Facebook
 X
X
 Pinterest
 Copy Link


A home that smells fresh feels fresh. But as all homeowners know, even after spending hours cleaning your home top to bottom, musty and unclean smells somehow find a way to hang around. We’ll take a look at some of the most common household odors and offer home cleaning tips to eliminate them room by room. Plug your nose, throw on a pair of rubber gloves, and let’s dive in!
1. Get Rid of Kitchen Odors
In many ways, the kitchen is the heart and soul of a home, but all that cooking and baking comes with a consequence: bad odors. From rotting food to stale air, the kitchen can easily whip up bad smells to combat. Start by emptying your refrigerator and use warm, soapy water to wipe down the shelves. Dispose of expired food products and clean up leaking food containers. Deep clean your dishwasher next, scrubbing those tough-to-reach spots in the back and clearing out the food traps. Next time you take out your garbage and compost, give the trash cans a quick wash with soapy water. Natural cleaning solutions can also help to supercharge your cleaning efforts. Baking soda can easily cut through grease, while lemon and salt can make a powerful mixture to eliminate odors. For more, read the following blog post:
2. Bathroom Cleaning Tips
The toilet and the shower are the main culprits in the bathroom for unwanted odors. Proactively cleaning and regularly maintaining your toilet can prevent bad smells and potential water damage from material buildup. Don’t let that toilet scrubber collect dust; regularly clean the rings in your toilet bowl and use toilet spray to maintain freshness. Your shower is a magnet for mold growth, especially around the ring of your bathtub and along the bottom of your shower curtain. Use a one-part white vinegar to four-parts water mixture in a spray bottle to clean your shower curtain, or simply throw it in the wash for a solo cycle next time you do laundry.
3. Carpet Cleaning
Your carpet and flooring may not immediately come to mind as candidates for emitting household odors, but they are. It is generally recommended to clean all household rugs and carpets every six to twelve months. If you do not have a carpet cleaner at home, they are widely available for rent at local hardware and/or carpet cleaning stores. If you have hardwood floors, purchase a hardwood cleaning solution to mix with water. Consider picking up some knee pads, too!
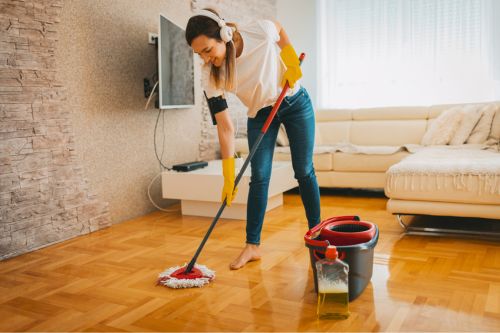
Image Source: Getty Images – Image Credit: Publishing Group
4. Eliminate Pet Odors
You can’t live without your furry friends, but sharing a home with them means you have to deal with some extra smells. Most importantly, clean up pet accidents right away to prevent lingering odors and potential damage. Regularly cleaning all pet toys eliminates germs and leaves them smelling fresh. The same goes for pet bedding and blankets: regularly run these items through the wash to absorb pet odors. And next time you’re at the store, consider picking up a pet-specific cleaning solution to really zap that pet must from the air.
5. Improve Home Air Quality
All odors travel to our noses by air. Improving air quality improves the health of your household while helping to eliminate odors. Consider investing in an air purifier with HEPA filters to remove dust, pollen, mold, and bacteria from the air in your home. Crack a window when cooking to let air cycle naturally and prevent it from getting stale.
6. Bedroom Cleaning Tips
In the bedroom, bad odors usually stem from fabrics and dirty clothes. Consider storing dirty laundry in the laundry room to banish all smelly clothing and add in a fabric freshener cleanse to your seasonal cleaning methods. After all, the bedroom is where you’re breathing air for hours at a time each night, so it’s worth it to purify your surroundings as much as possible. Also consider adding candles or essential oils to really sweeten the air in the bedroom.