Facebook
 X
X
 Pinterest
 Copy Link


The following analysis of select counties of the Utah real estate market is provided by Windermere Real Estate Chief Economist Matthew Gardner. We hope that this information may assist you with making better-informed real estate decisions. For further information about the housing market in your area, please don’t hesitate to contact your Windermere Real Estate agent.
Regional Economic Overview
Continuing the trend that started last summer, employment growth in Utah continues to taper. Over the past 12 months, the state added 52,600 jobs. At an annual rate of 3.2%, this was the slowest percentage growth since Utah started recovering jobs post-COVID. Although this is an improvement over the rate in the last quarter, annual adjustments to the data gave early 2023 data a boost. The counties covered by this report added more than 38,600 new jobs over the past year, representing a growth rate of 2.8%. The fastest growing county was Summit, with a 4.8% increase in employment. The slowest was Morgan County, where the job level rose .7%. Utah’s unemployment rate in February was 2.4%, matching the level at the end of 2022. The labor force continues to grow but, so far, it has not caused the jobless rate to rise, which is very impressive.
Utah Home Sales
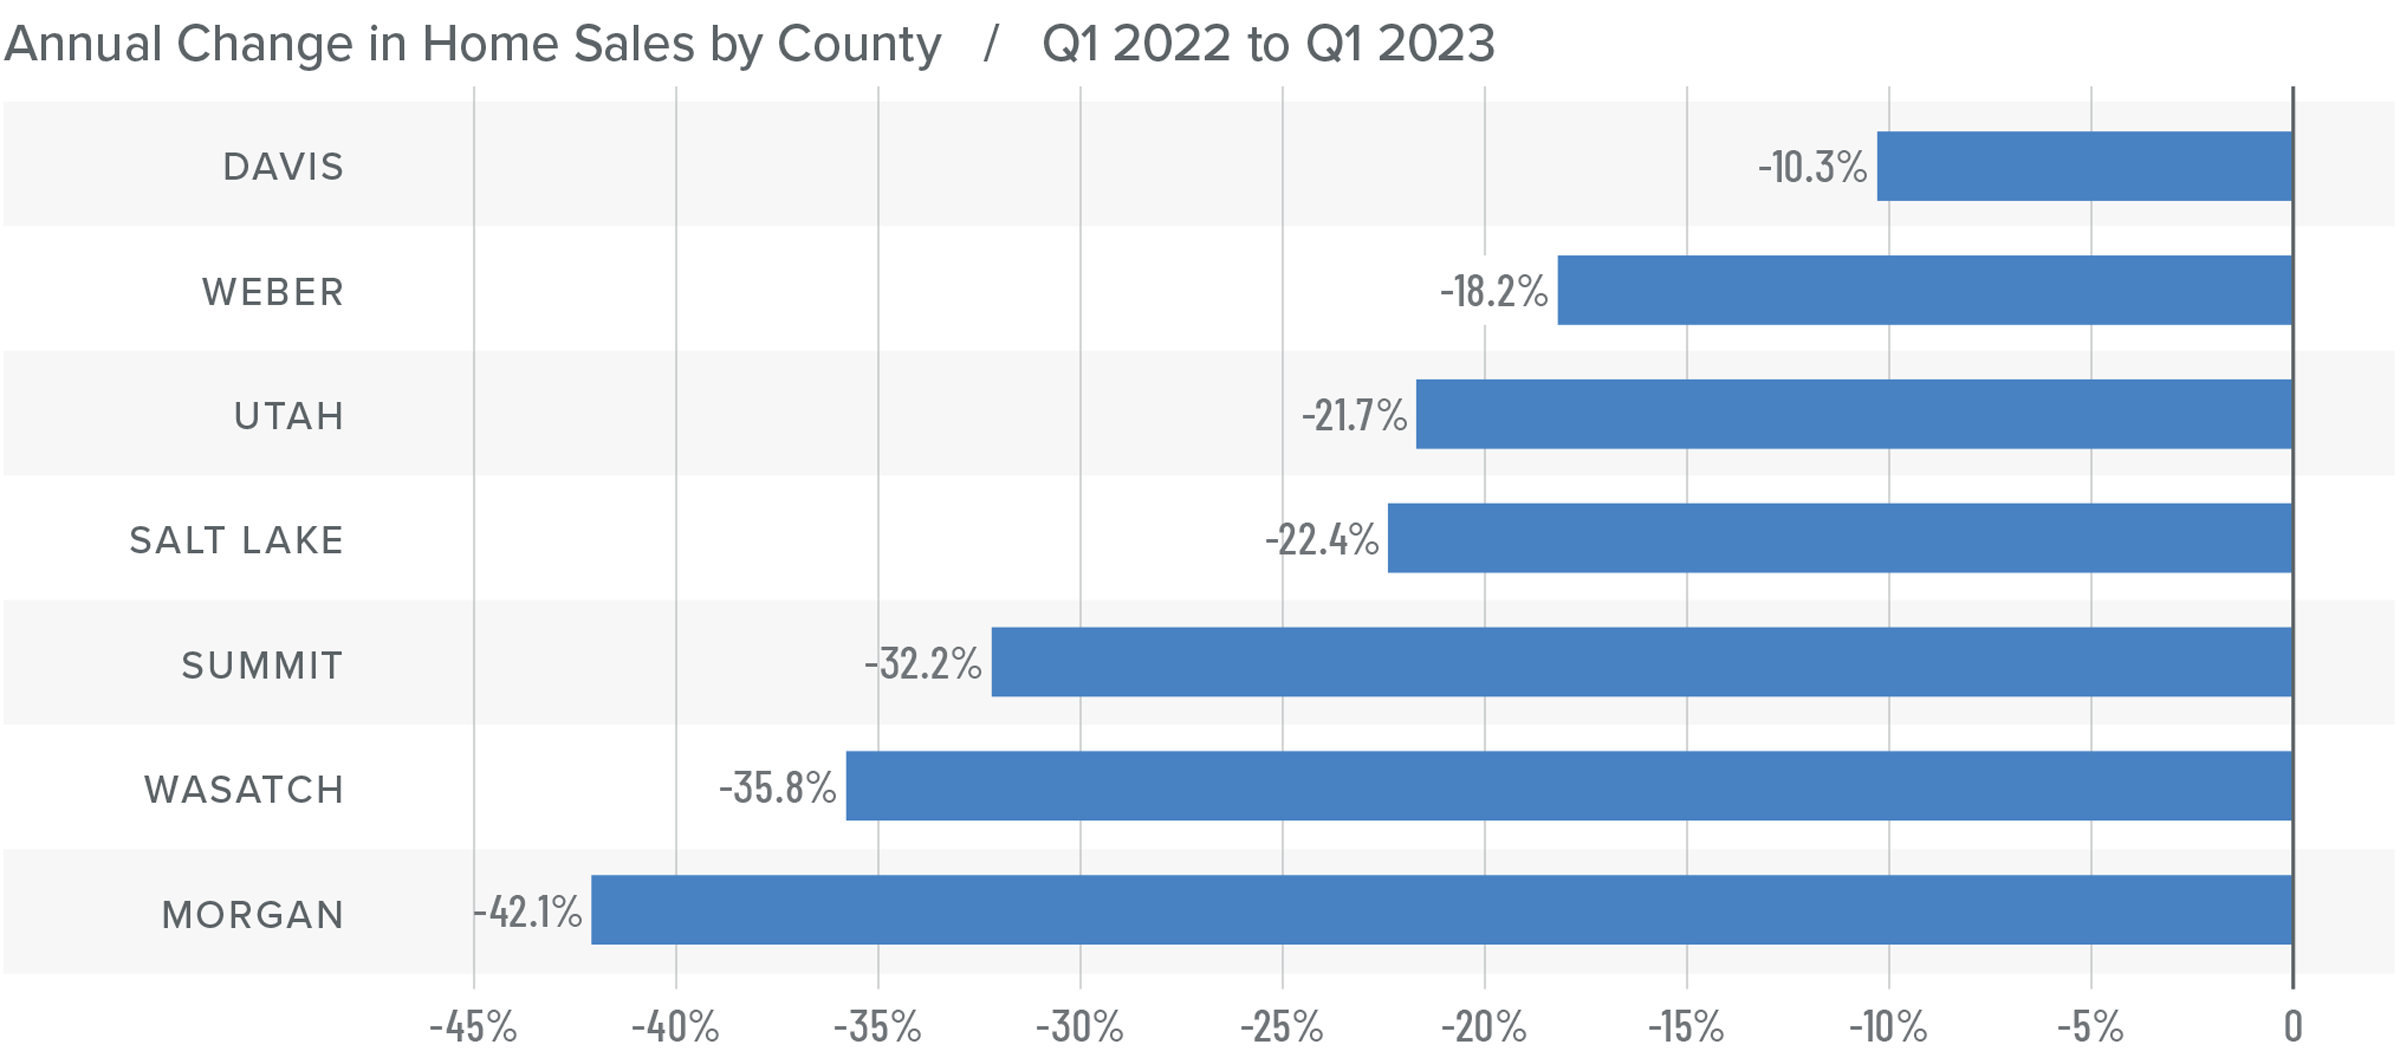
❱ In the first quarter of the year, 5,251 homes sold. This was down 21% compared to the first quarter of 2022. Sales were .2% higher than in the fourth quarter of last year.
❱ Year over year, sales fell across the board. Compared to the fourth quarter, sales rose in Utah and Weber counties but fell in the rest of the market areas covered by this report.
❱ The number of homes for sale plummeted by one third when compared to the fourth quarter of 2022, making any increase in sales rather impressive.
❱ Pending sales jumped 38.3% from the fourth quarter, suggesting that closings in the second quarter of this year may rise further.
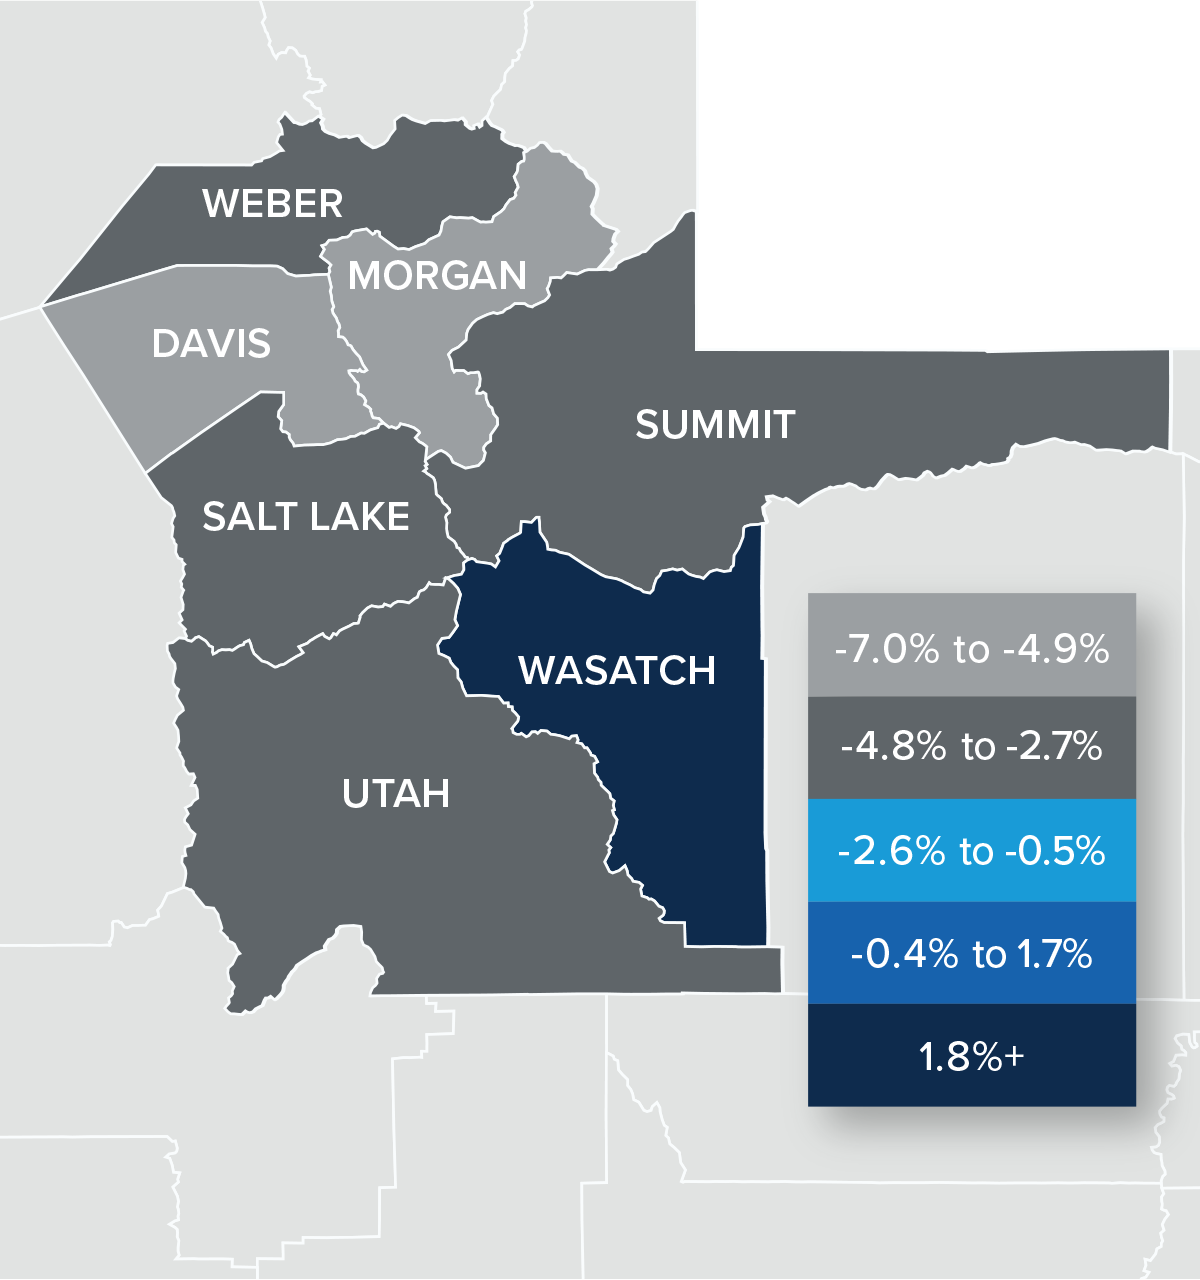
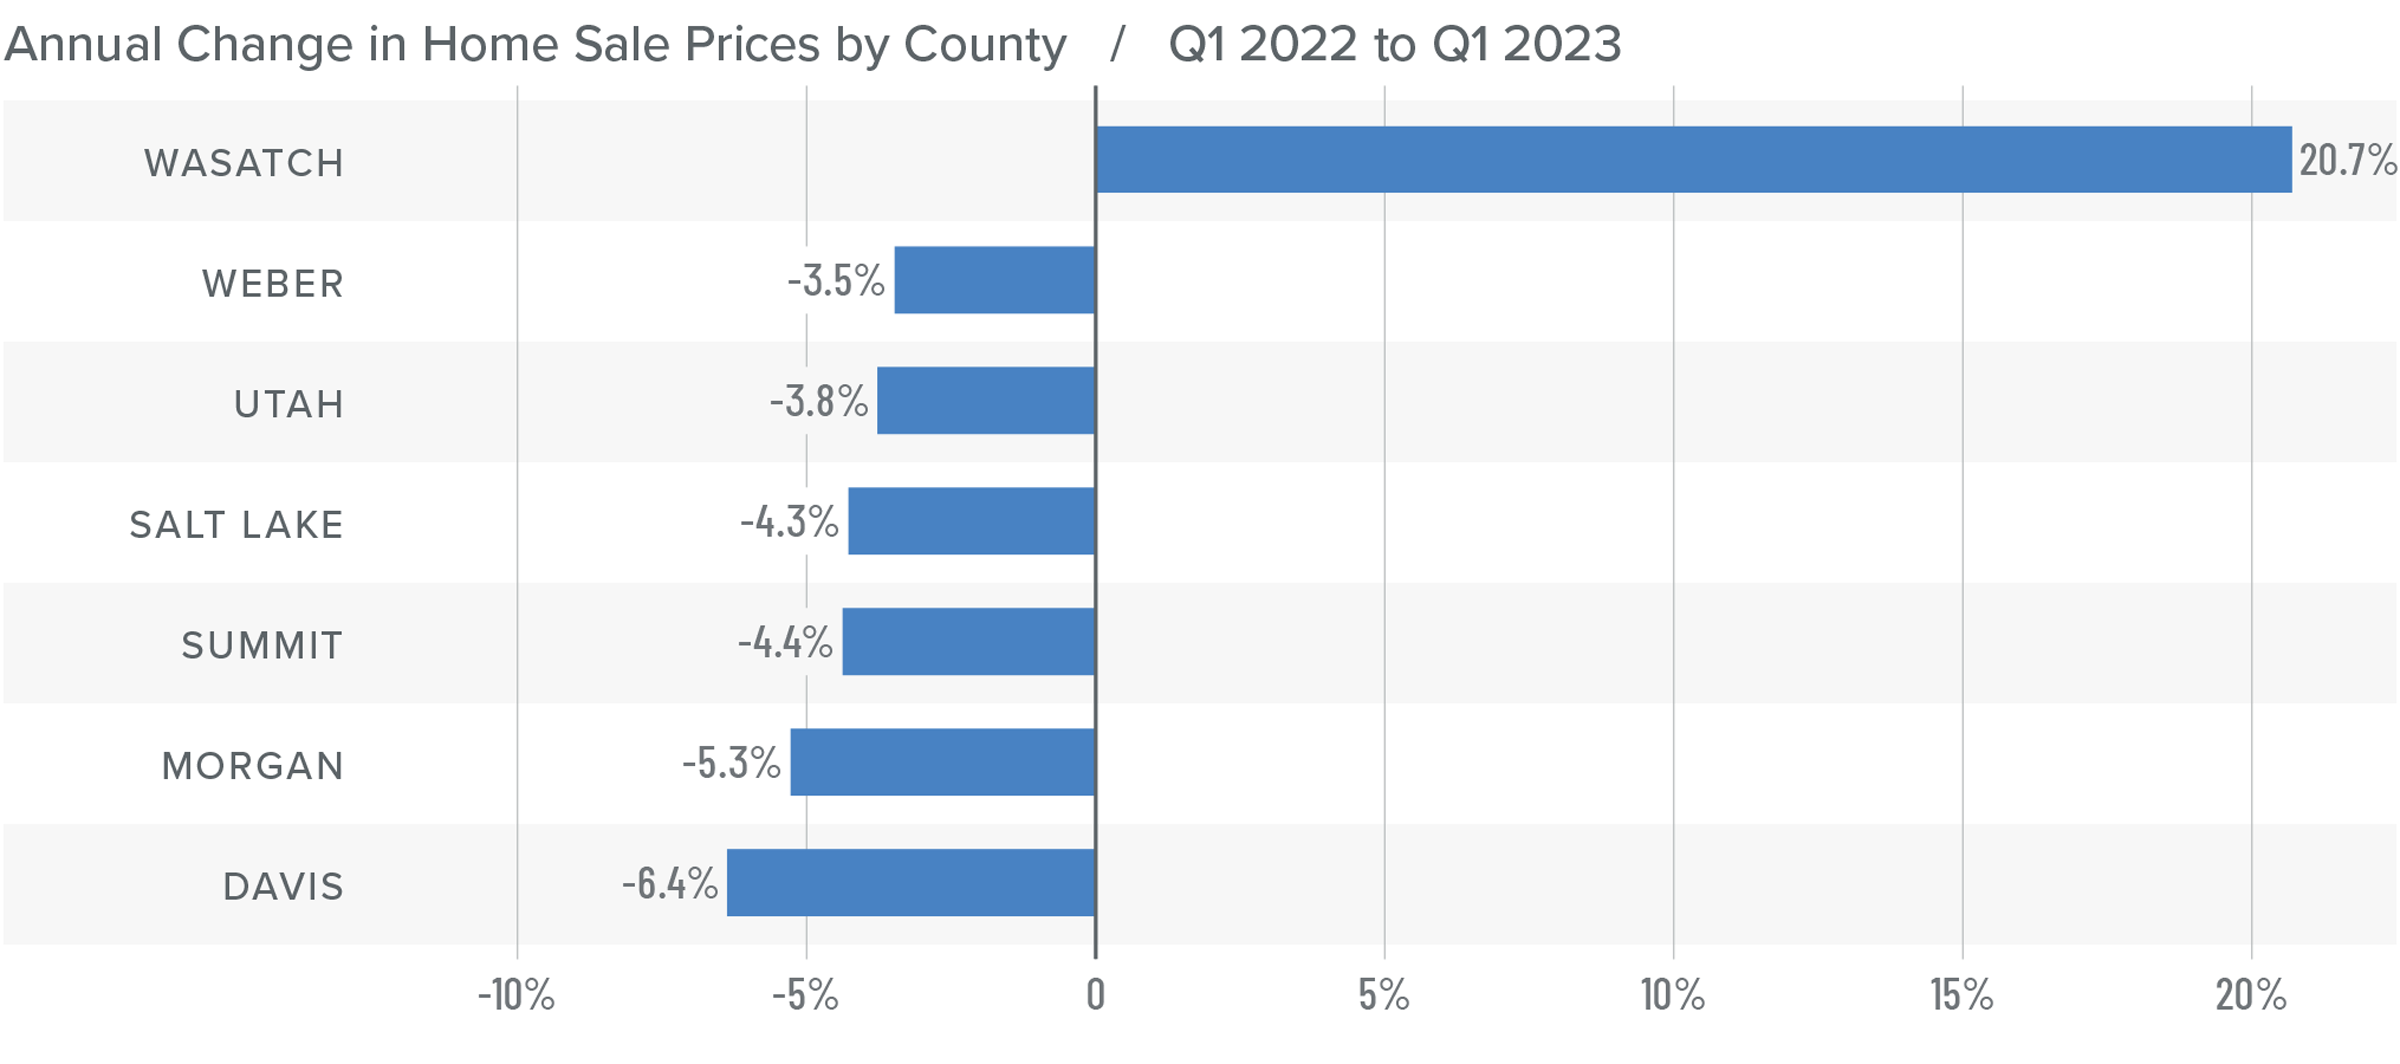
Utah Home Prices
❱ The average sale price in the first quarter of the year fell 5.3% compared to the first quarter of 2022 to $603,340. Prices were also .1% lower than in the fourth quarter of 2022.
❱ Median listing prices in the first quarter were 3.7% higher than at the end of last year, suggesting that home sellers remain confident about the spring market. Of the counties covered by this report, only Wasatch and Morgan counties saw listing prices fall compared to the prior quarter.
❱ Year over year, prices rose in Wasatch County but fell in the other markets. Compared to the fourth quarter of 2022, prices rose in Morgan, Summit, and Wasatch counties.
❱ The market is correcting. Although this may not be something sellers want to see, it is important to return to some sense of normalcy following the frantic, low-mortgage-rate-induced market of the pandemic period. There will be a relatively modest decline in prices in the coming months, but I expect home values to rise again in the second half of this year.
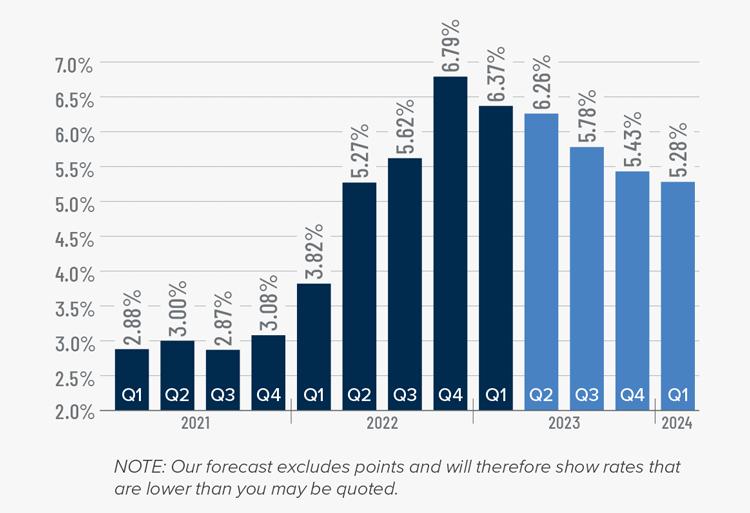
Mortgage Rates
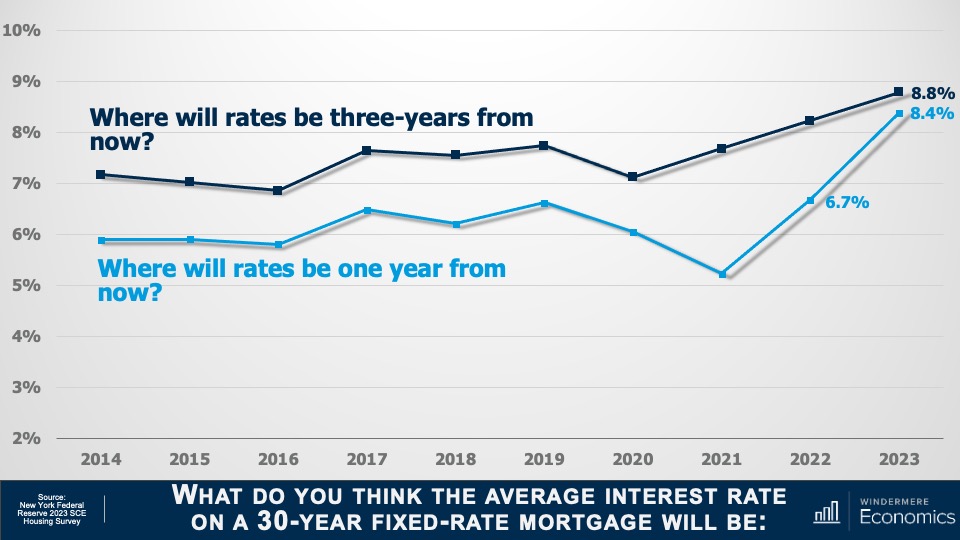
Rates in the first quarter of 2023 were far less volatile than last year, even with the brief but significant impact of early March’s banking crisis. It appears that buyers are jumping in when rates dip, which was the case in mid-January and again in early February.
Even with the March Consumer Price Index report showing inflation slowing, I still expect the Federal Reserve to raise short-term rates one more time following their May meeting before pausing rate increases. This should be the catalyst that allows mortgage rates to start trending lower at a more consistent pace than we have seen so far this year. My current forecast is that rates will continue to move lower with occasional spikes, and that they will hold below 6% in the second half of this year.
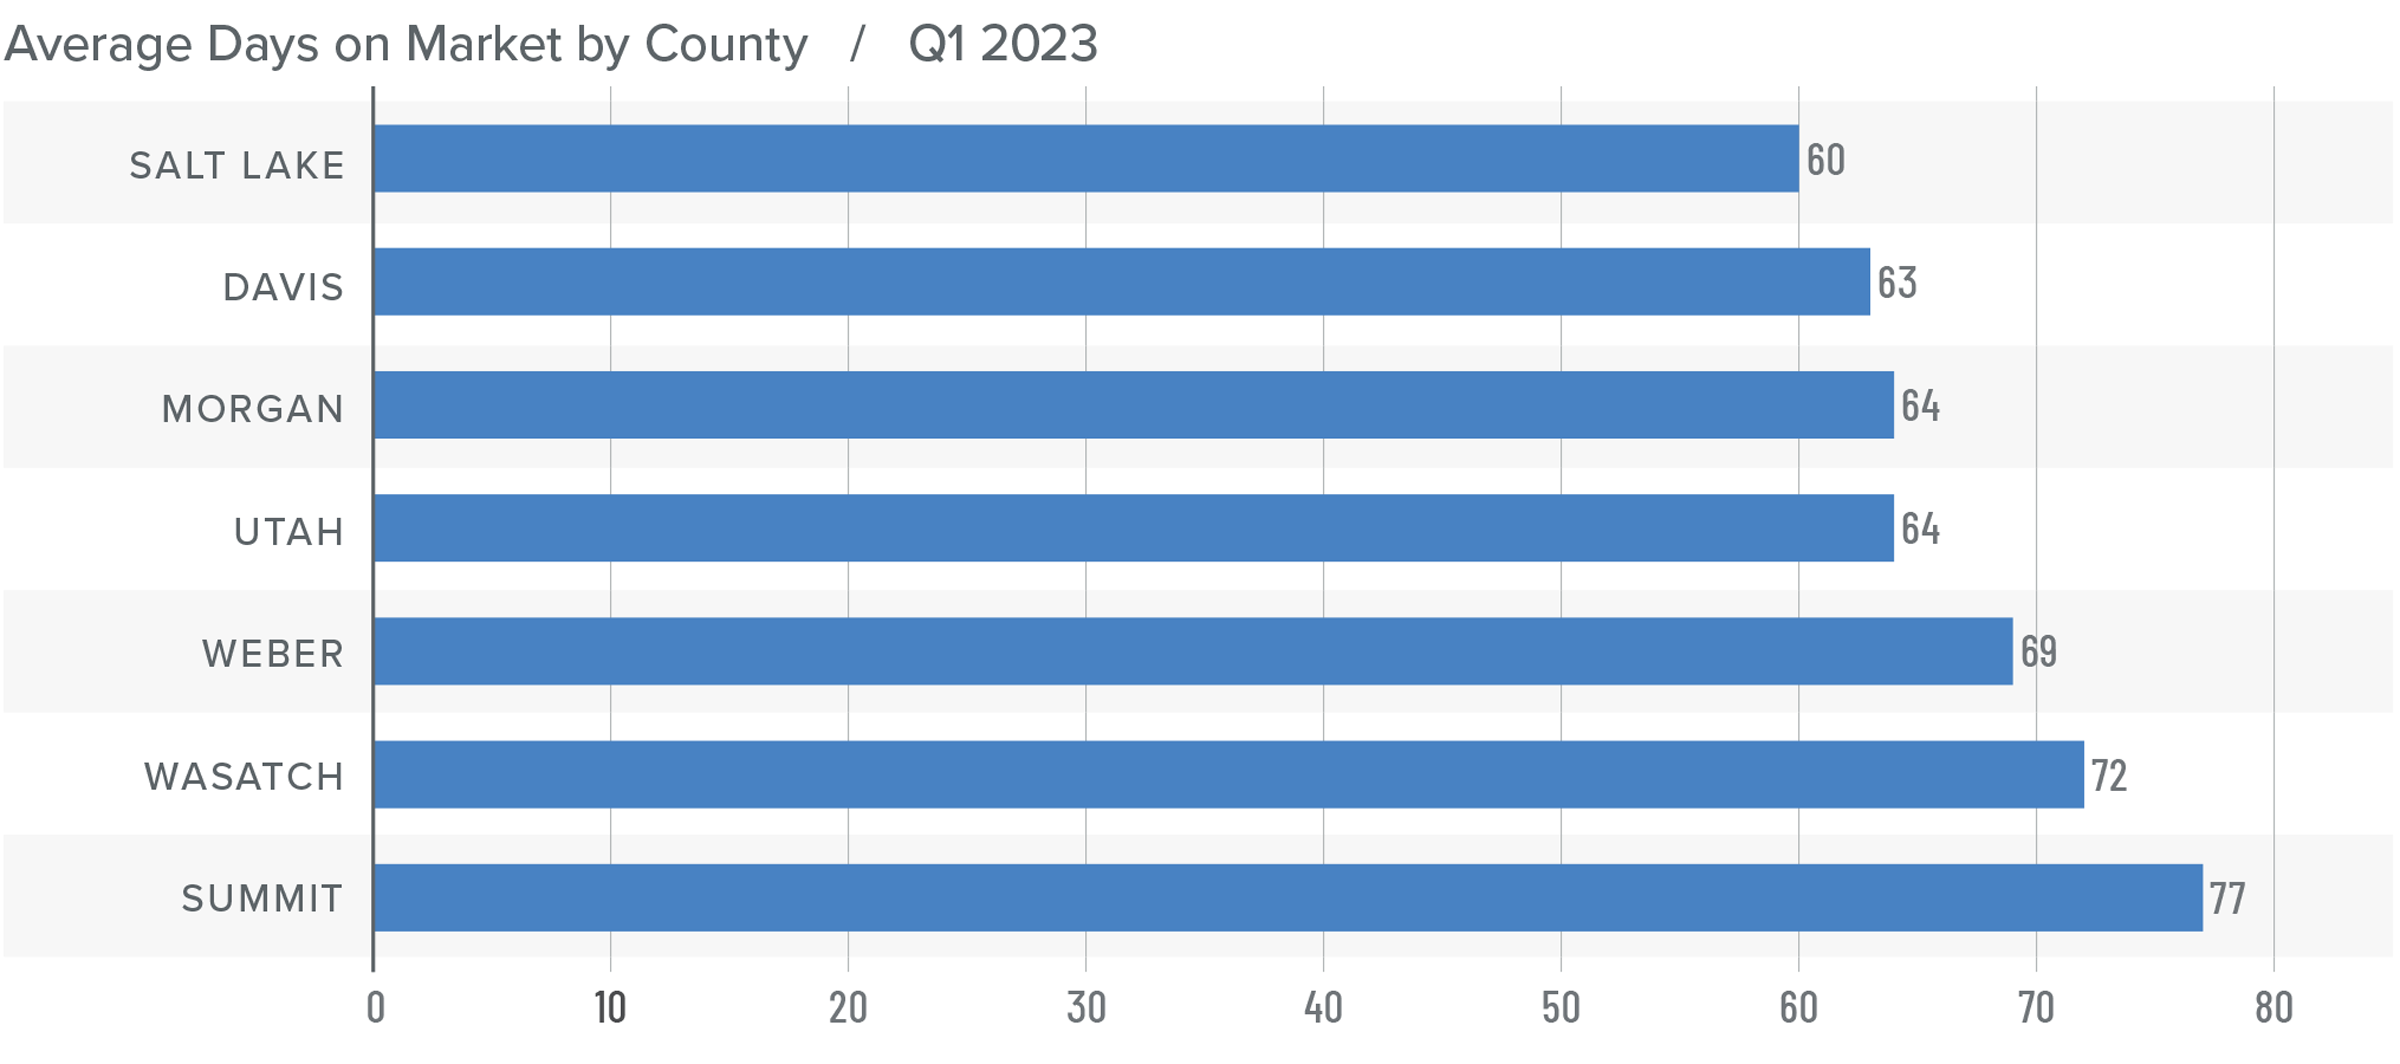
Utah Days on Market
❱ The average time it took to sell a home in the counties covered by this report rose 42 days compared to the same period in 2022.
❱ Homes again sold fastest in Salt Lake County and slowest in Summit County. All areas saw average market time rise compared to the prior quarter as well as the same quarter in 2022.
❱ During the quarter, it took an average of 67 days to sell a home, which was an increase of 9 days compared to the final quarter of 2022.
❱ Although average market time rose compared to the fourth quarter of last year, the increase was not significant. Lower inventory levels may lead to market time pulling back again as we get into the spring months, or at least levelling out.
Conclusions
This speedometer reflects the state of the region’s real estate market using housing inventory, price gains, home sales, interest rates, and larger economic factors.
Higher financing costs and lower affordability rates are acting as headwinds in the housing market, which is offsetting the benefit that housing normally sees from a growing economy. I have stated previously that home prices in Utah would continue to moderate but that a major downward correction was unlikely. That prediction appears to have been accurate. I believe that the market is very close to bottoming out given low inventory levels, rising pending and closed sales, and higher listing prices—all of which benefit home sellers. That said, lower home prices and longer days on market tend to favor home buyers.
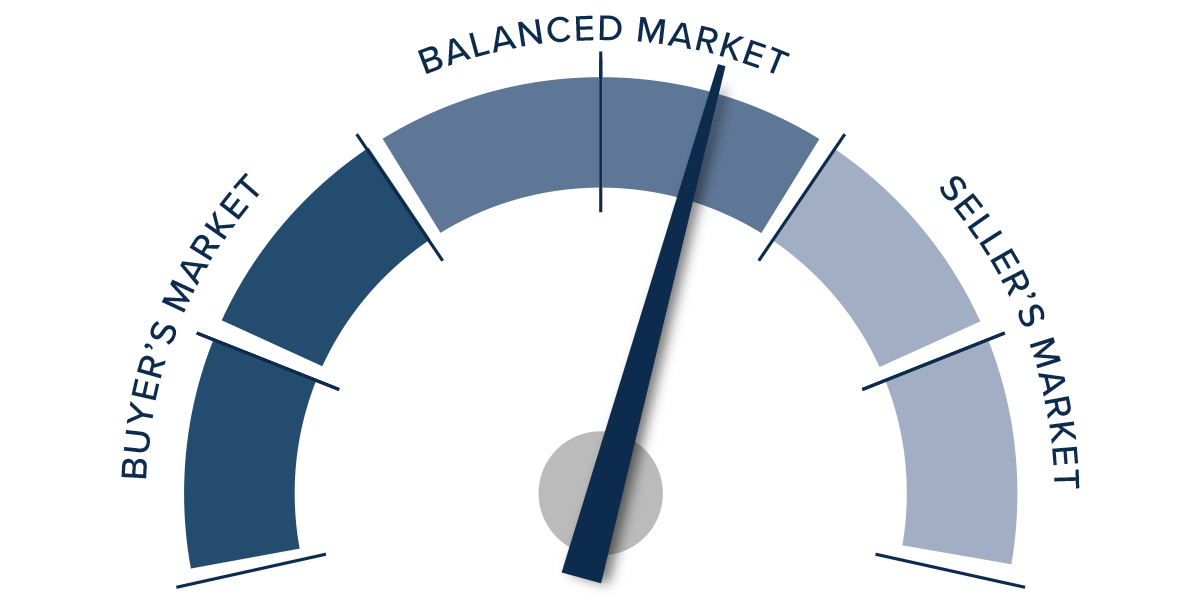
Ultimately, I would describe the market as balanced, but I am tilting the needle just a little in favor of sellers. I expect that mortgage rates will start to stabilize as we move through the spring and then start to drop a little. If this occurs and inventory levels do not rise significantly, then we will certainly be back in a position that more firmly favors home sellers.
About Matthew Gardner

As Chief Economist for Windermere Real Estate, Matthew Gardner is responsible for analyzing and interpreting economic data and its impact on the real estate market on both a local and national level. Matthew has over 30 years of professional experience both in the U.S. and U.K.
In addition to his day-to-day responsibilities, Matthew sits on the Washington State Governors Council of Economic Advisors; chairs the Board of Trustees at the Washington Center for Real Estate Research at the University of Washington; and is an Advisory Board Member at the Runstad Center for Real Estate Studies at the University of Washington where he also lectures in real estate economics.