Facebook
 X
X
 Pinterest
 Copy Link
SOURCE: Windermere

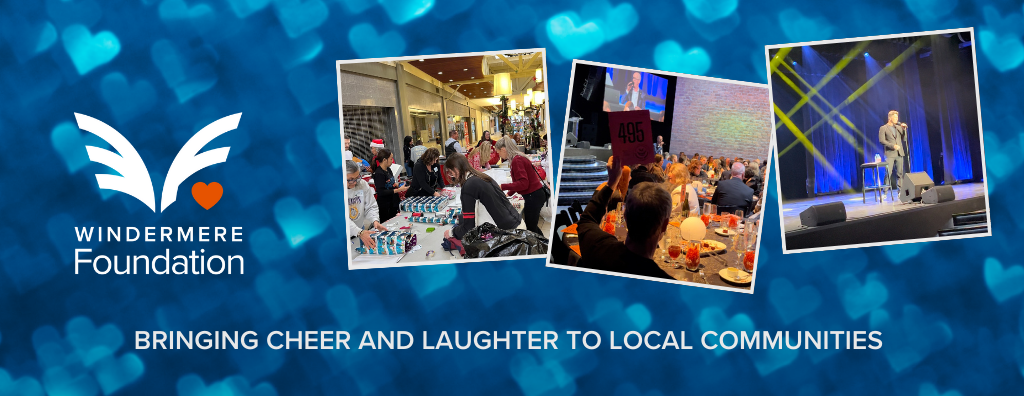
Windermere Real Estate offices throughout the Western U.S. brought holiday cheer and laughter to their local communities during the holiday season of 2023, wrapping up a year of giving that raised over $2.9 million for the Windermere Foundation, bringing the total raised since 1989 to more than $53 million.
Here are a few examples of the support provided by Windermere offices through the Windermere Foundation in the fourth quarter of 2023.
Bringing Holiday Cheer
Under Cover Elves in Central Washington
Windermere Group One continued a tradition and brought some holiday cheer to 21 deserving local families with their “Under Cover Elves” program. Since 2010, they have worked with the counselors at local schools to find and “adopt” families who were not able to buy gifts due to their financial situations. This year, some of the families were homeless, others were struggling after layoffs.
The school counselors mentioned too, that many support programs were not happening this year for families in need and they were grateful that the local Windermere offices were making this happen with Windermere Foundation funds.
More than 40 Windermere Real Estate agents and staff volunteers went shopping with the kids to buy presents for their parents and siblings. Many of the kids didn’t ask for things themselves, most lists consisted of everyday essentials like food, clothing, and cleaning supplies. But the volunteers were determined to add a few surprises too, so they did some digging while they shopped to find toys that they could add to the presents under the tree.
“The families were blown away from this event, so many thank you’s and tears of gratitude,” said Mikaya Blossner-Hill, the Marketing Director for the Windermere Group One offices.
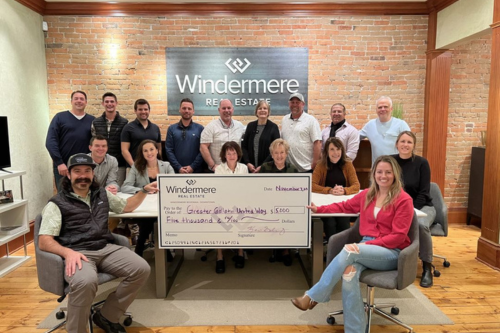
Image Sources: Windermere Bozeman, MT on Facebook
Giving Back in Bozeman, Montana
The team at the Windermere Bozeman-Downtown office is fully devoted to supporting their neighbors in need and have a collective commitment to bettering the community they call home. One example of this is the $5,000 donation they made from the Windermere Foundation to the during the Greater Gallatin United Way weeks leading up to the holidays. The Greater Gallatin United Way raises funds from the community in order to invest in local non-profits working in four impact areas: basic needs (shelter, food security, transportation, and childcare), early learning, youth success, and behavioral health and mental well-being. The members of the Windermere Bozeman-Downtown office say that they feel incredibly fortunate to have the Greater Gallatin United Way looking out for their neighbors and their community.
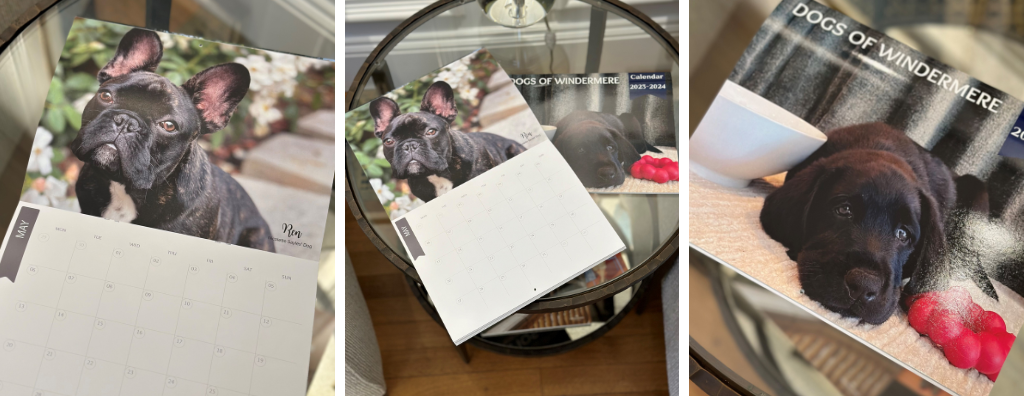
Image Source: Melissa Freels, Director of Marketing Windermere Services, Oregon
Raising Funds with a Crowd Favorite in Portland, Oregon
The Windermere Johnson office in Portland, Oregon held a fundraiser that made many people smile and raised money for the Windermere Foundation. At the end of 2023 they put together a “Dogs of Windermere” calendar for the year 2024. This adorable fundraiser earned over $1,100 for the Windermere Foundation by selling copies of the calendars and with submissions from agents who sent in the cutest photos of their dogs they could muster; it wasn’t that hard. With such a successful first run they plan to do it again next year.
Windermere For Kids in Bellevue, Washington
Continuing their yearly tradition, Windermere East, Inc. helped deliver holiday spirit to low-income and homeless families from in and around Bellevue, Washington with their “Windermere for Kids” event. In December, they invited over 100 local children to the Marketplace at Factoria to do their holiday shopping with 250 agents from six Windermere offices.
Each child and their families received $250 to buy gifts at Target, which were then wrapped by the Windermere Real Estate agents while the families enjoyed snacks and took photos with an elf. And as an added treat, the agents who helped them shop added a surprise gift for each “Little Shopper.”
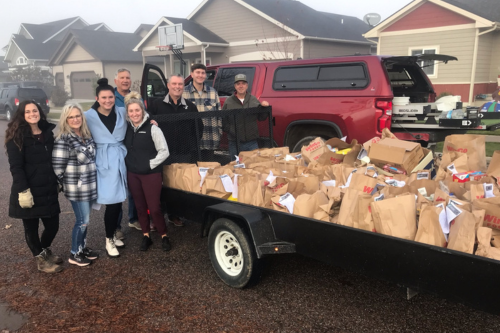
Image Sources: Windermere Missoula, MT on Facebook
Can the Cats in Missoula, Montana
The agents in the Windemere Missoula office continued their tradition of collecting and donating food to the for their annual “Can the Cats Food Drive”. Now in its twenty-fourth year, the Can the Cats Food Drive is held every November leading up to the University of Montana vs. Montana State University “Griz-Cat Brawl of the Wild” rivalry football game. Missoulians are encouraged to donate food and cash which benefits thousands of households experiencing food insecurity in Missoula County. The Windermere Missoula team collected over 2,000 pounds of food from their local community which was delivered in bags donated by WinCo Foods Missoula. This was the eighth year Windermere Missoula participated in this event which Managing Broker John Brauer says is great fun and an incredible team-building experience.
Bringing Laughter and Raising Funds in Portland, Oregon and Seattle, Washington
Comedy Night
The Windermere Foundation expanded the annual comedy night held in Portland, OR for the last 22 years to bring even more laughter and raise more money with another event in Seattle, WA.
Both events in 2023 featured Saturday Night Live comedian, Colin Jost. Together they raised over $1.1 million for local organizations supporting youth and families in need.
The annual Steve Allen Comedy Show in Portland, OR was founded by Windermere and benefits non-profit organization New Avenues for Youth, which is dedicated to the prevention and intervention of homelessness for Portland-area young people. The event helps New Avenues for Youth provide programs and services to young people in Portland that focus on the individual – their experiences, identities, needs and goals—and helping them make positive changes in their lives. From meals and counseling to job training and housing, their equity-based services address the many barriers to stability and well-being that young people face.
The inaugural Windermere Foundation Comedy Night in Seattle was organized by and benefited the Windermere Foundation, which has been giving back to the local communities where Windermere Real Estate agents live and work for 35 years. More than 400 people came together for a laughter-filled evening that included dinner, drinks, and an amazing amount of generosity. The money raised from ticket sales and the paddle raise will support organizations in the Seattle area that provide services to low-income and homeless children and families.
SOURCE: Windermere