Imagine a home-buying scenario where you make an offer, the seller immediately accepts, and the two of you move through closing without any hiccups until you have keys in hand. It’s possible, but a more likely home buying experience is marked by negotiation, counteroffers, and a back-and-forth dialogue between both parties to reach a deal. And in some cases, the deal can fall through.
Contingencies protect buyers and sellers against these natural characteristics of the home buying process and any problems that may arise before a home sale is finalized. They help to shape a buyer’s offer and can be used strategically to make it more appealing. Whether you’re a first-time home buyer or you’ve bought before, you should be aware of common real estate contingencies and the role they play in making an offer on a home.
Making a Contingent Offer on a Home
After you and the seller agree on the price of a home, both parties have certain duties to finalize the transaction. Buyers are responsible for securing financing, having the home inspected, and getting the property appraised. Sellers are responsible for prioritizing the offer on the table and opening their doors to the home inspector when the time comes. The agreed-upon contingencies included in the contract protect the buyer and seller against any issues that may arise during this time.
Contingencies present a spectrum of options to home buyers, allowing them to walk away from a real estate transaction with their earnest money intact or renegotiate the contract. While their inclusion offers protection and negotiating leverage, sometimes their exclusion can be just as effective.
In a seller’s market, competition amongst buyers is high. Escalation clauses, bidding wars, and all-cash offers become commonplace as potential home buyers compete for a limited number of listings. To sweeten their offers in such market conditions, buyers will typically waive their contingencies. This presents added risk due to a lack of protection, but with so much competition around them, buyers are left with no choice but to maximize their offer’s appeal.
After you’ve made an offer, you’ll have a home inspector thoroughly examine the home before the deal is final. If they discover issues with the property, this contingency allows you and your agent to present the seller with a new offer that accounts for the home’s lessened condition, or to cancel the contract entirely.
Financing Contingency
Also known as a “mortgage contingency,” a financing contingency gives the buyer a specified period of time to secure adequate financing to purchase the home. Even if you are pre-approved for your mortgage, you may not be able to obtain the right loan for the home. If you are unable to finance the purchase, this contingency allows you to back out of the contract and recover your earnest money, and the seller can re-list the home.
Appraisal Contingency
An appraisal contingency states that the home must appraise for, at minimum, the sales price. It allows you to walk away from the deal if the property’s appraised value is lower than the sales price, and typically guarantees that your earnest money will be returned.
Home Sale Contingency
If you’re buying a new home while selling your current one, you may want to include a home sale contingency in your offer. This contingency specifies the date by which you’ll need to sell your current home in order to move forward with your offer. If you don’t sell your home by the specified date, the contract is terminated. Home sale contingencies are financially appealing in that they allow buyers to use the proceeds from their home sale to fund their new home purchase. However, these contingencies force sellers to wait until the buyer’s current home sells, which means they likely won’t accept such offers in competitive markets.
Title Contingency
Before the sale of a home goes final, a search will be performed to ensure that any liens or judgements made against the property have been resolved. A title contingency allows you to raise any issues you may have with the title status of the property and stipulates that the seller must clear these issues up before the transfer of title can be complete. If an unpaid lien or unpaid taxes turn up in the home’s title search, this contingency also allows you to back out of the deal and look for another home.
Give me a call to learn more about preparing a winning offer.
This video is the latest in our Monday with Matthew series with Windermere Chief Economist Matthew Gardner. Each month, he analyzes the most up-to-date U.S. housing data to keep you well-informed about what’s going on in the real estate market.
Hello there, I’m Windermere’s Chief Economist Matthew Gardner and welcome to this month’s episode of Monday with Matthew. A little while ago, a housing analyst was being interviewed about the current state of the residential market and they suggested that the country is in a “housing recession.” Well, needless to say, this got a lot of attention from the media and the public at large—for obvious reasons.
Any time the word “recession” is mentioned we almost subliminally cast our minds back to 2007. And when the word “recession” is combined with the word “housing,” then panic starts to set in with flashbacks of headlines about burgeoning housing supply, plummeting home prices, and surging foreclosures.
As this is a topic being discussed by many across the country right now, I wanted to share with you my opinion as to whether the phrase “housing recession” is an appropriate one when describing today’s market.
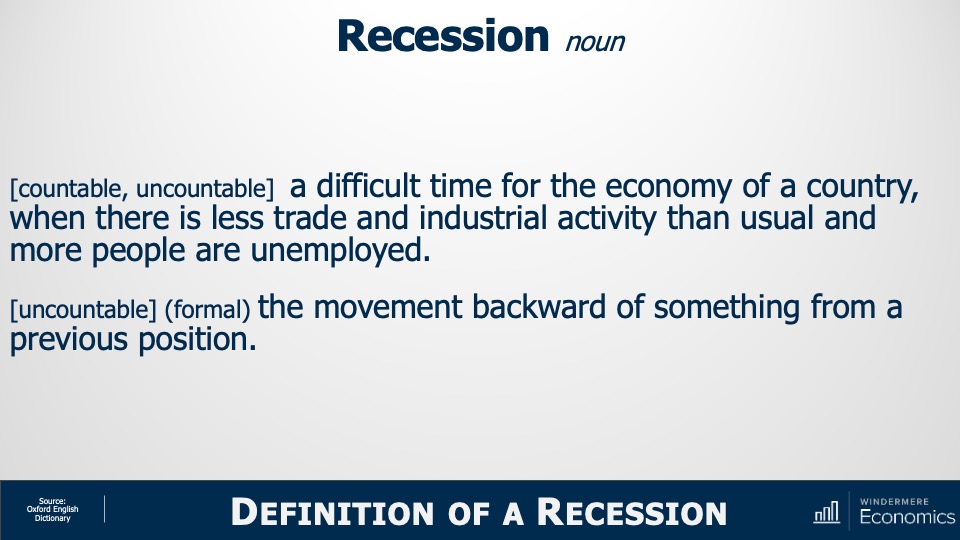
So, what is a recession? To answer this, I will turn to my trusted Oxford English Dictionary, and this is how they describe that word.
Definition of a Recession
Image Source: Matthew Gardner
Recession:
a difficult time for the economy of a country, when there is less trade and industrial activity than usual, and more people are unemployed
the movement backward of something from a previous position
Well, how do we use these definitions when it comes to the ownership housing market?
I guess that “less trade” could mean lower sales and we have certainly seen sales pull back. “Movement backward” could be how someone might describe the fact that sale prices have been pulling back in many markets across the country.
But although some may say that we really are in a housing recession given the definition of the word, is it really accurate? Are we are inextricably headed down a road that leads to the bursting of some sort of bubble as we all remember from 2007? I don’t believe we are. To explain my thinking let’s start out by looking at housing supply.
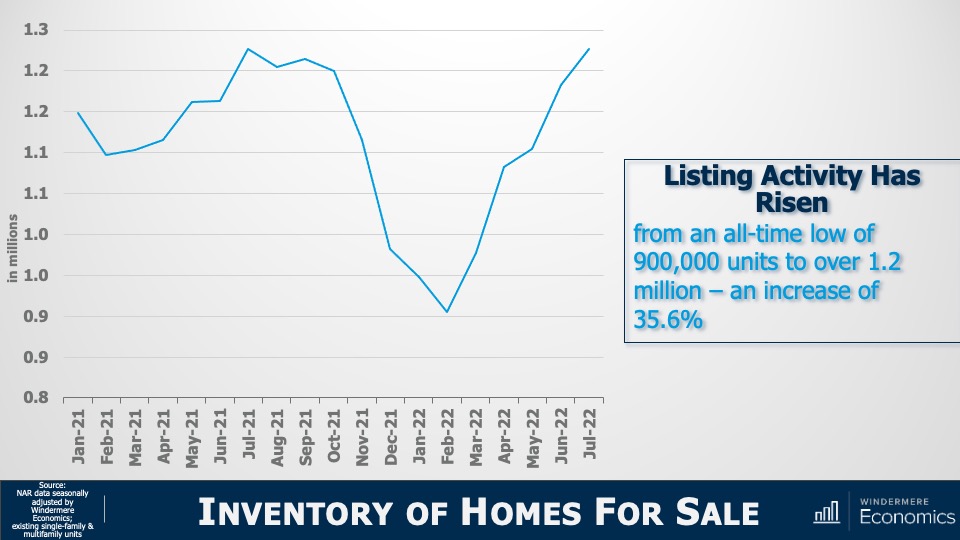
Inventory of Homes for Sale
Image Source: Matthew Gardner
Yes, listing activity is up—can’t argue with that—with the number of resale homes for sale jumping by more than a third from the start of this year. But there’s more to it than that. You see, we have to look a little further back to better understand what’s really going on.
And to do this, let’s check out the number of homes for sale during the first seven months of this year and compare those numbers to the same periods in 2018 through 2021.
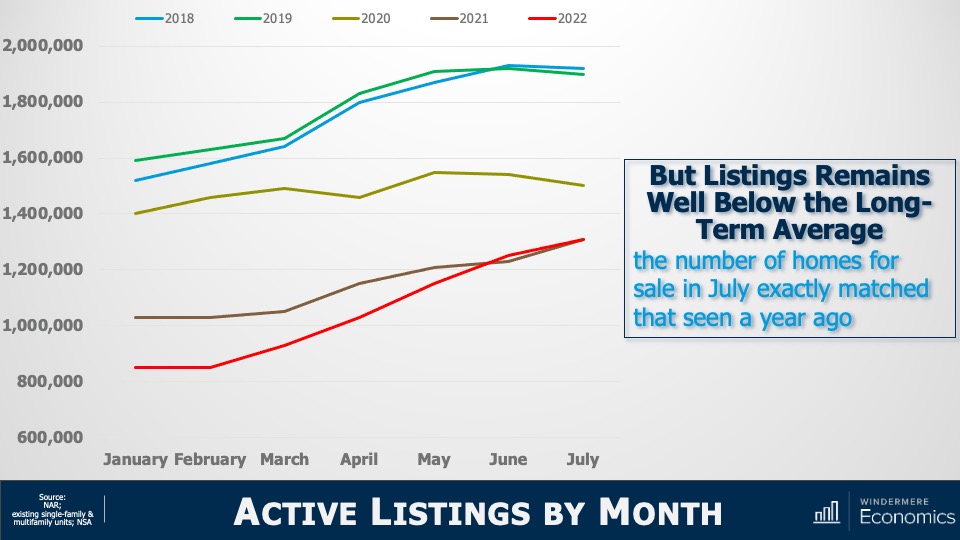
Active Listings By Month
Image Source: Matthew Gardner
I don’t know about you, but this doesn’t look like a chart showing a massively oversupplied market! The number of homes for sale in July of this year was almost exactly the same as we saw last July and is still well below the levels seen in 2018, 2019, or 2020.
Sure, listings are up. But are we at levels that will cause prices to tumble? Remember that it was a massive increase in the number of homes for sale that led to the housing bubble bursting back in 2007. Listings peaked at almost 3.9 million units in 2006; but today there are 2.6 million fewer units on the market than we saw back then. Now that we’ve seen that supply isn’t at concerning levels, let’s look at demand.
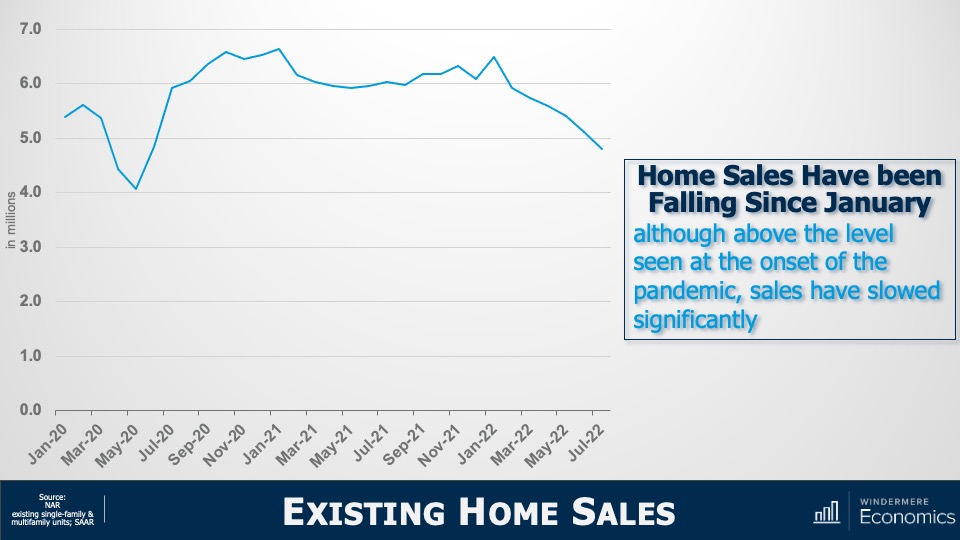
Existing Home Sales
Image Source: Matthew Gardner
This chart doesn’t look too good. On an annualized basis, sales have been pulling back since the start of the year but that’s not the full story. Let’s look at this in a slightly different way.
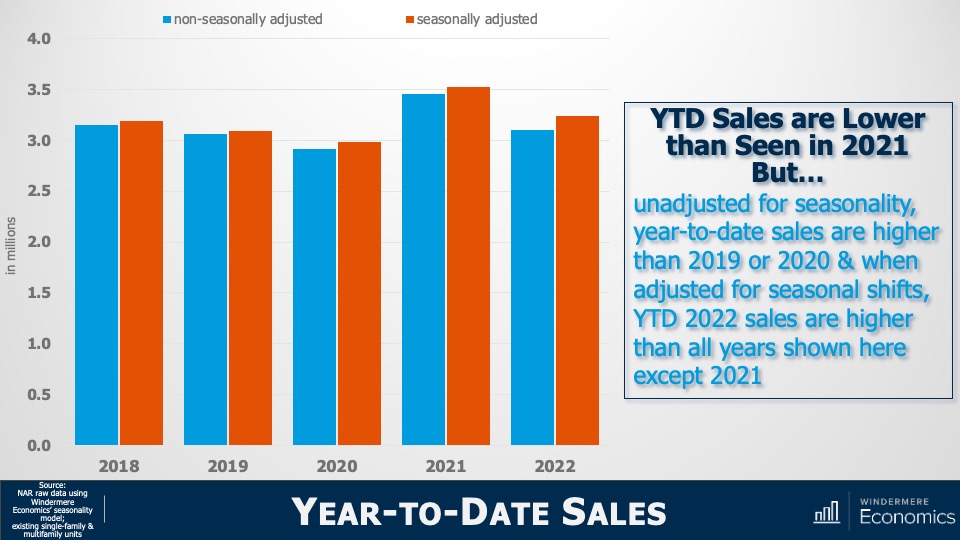
Year-to-Date Sales
Image Source: Matthew Gardner
The bars here show year-to-date sales through July—both adjusted and unadjusted for seasonality—and although unadjusted sales so far this year are lower than we saw during the first seven months of 2021, they are at about the same level as we saw in 2018 and are higher than in 2019 or 2020.
But when we adjust the monthly sales data for seasonality, year-to-date sales in 2022 were higher than all years shown here other than 2021.
So, although sales have fallen, it appears to me that we are heading back to a more realistic market rather than one that is hemorrhaging. Yet another indicator we need to consider when examining the market for evidence of some sort of recession are months of inventory , which shows how long it would take to sell every home for sale using the current monthly sales pace.
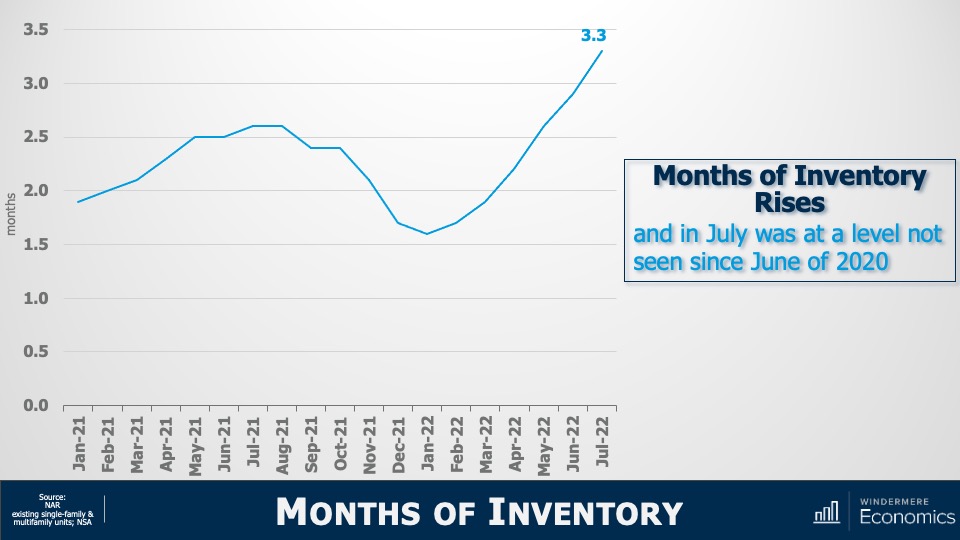
Months of Inventory
Image Source: Matthew Gardner
This graph shows that it would take three months to sell every home on the market given the sales we saw in July. That is quite a jump from the January pace but, again, perspective is everything.
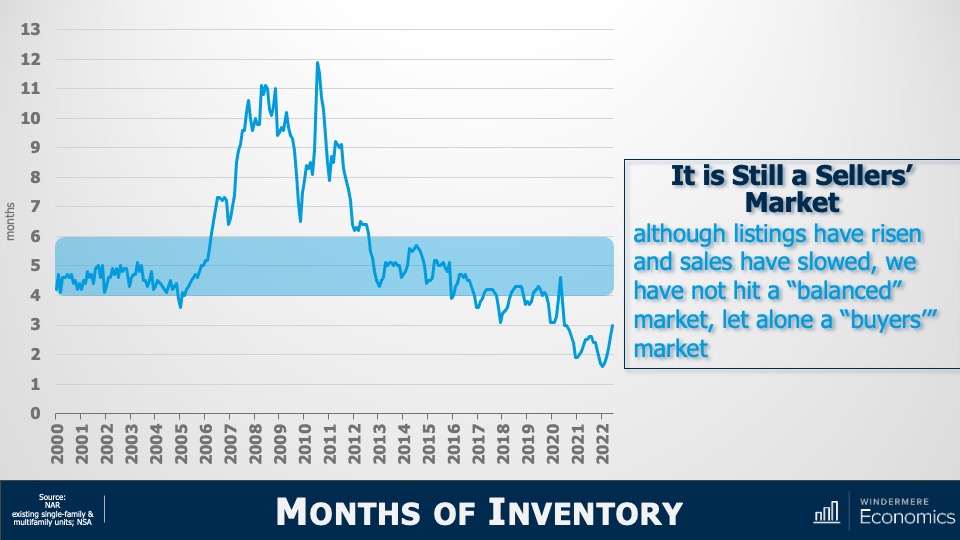
Months of Inventory: Seller’s Market
Image Source: Matthew Gardner
At three months, it is still a seller’s market. It’s generally accepted that the definition of a seller’s market is any number below four months; a balanced market is four to six months of inventory, and a buyer’s market is when the month of inventory is above six.
And a simple bit of math shows us that, for the market to shift from favoring sellers to favoring buyers, the number of homes for sale must break above two million—which we haven’t seen since 2015—and monthly sales would have to drop to below 300,000. We’ve only seen that happen three times in history: November 2008, and again in July and August of 2010.
Yes, listings are up, and sales are down. There’s no denying it. But, again, does the data justify the term recession? My answer would be no. But, if you’re still not convinced, let’s turn our attention to sale prices. I think that might help make things even clearer.
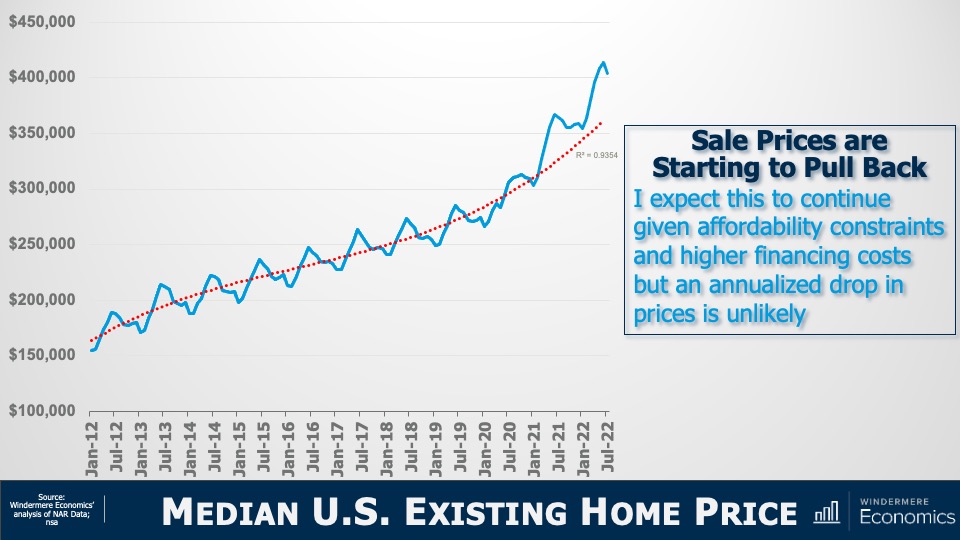
Median U.S. Existing Home Price
Image Source: Matthew Gardner
The solid line represents the median sale prices of homes over time and the dotted line shows the trend. You can clearly see that we started breaking away from the trend line in early 2021 and that’s not at all surprising as it started the month after mortgage rates hit their historic all-time low.
But today’s financing costs are significantly higher, and prices have started to slide. Although I certainly expect that we will see sale prices fall further, it appears to me as if they are simply moving back to the long-term trend, and not collapsing.
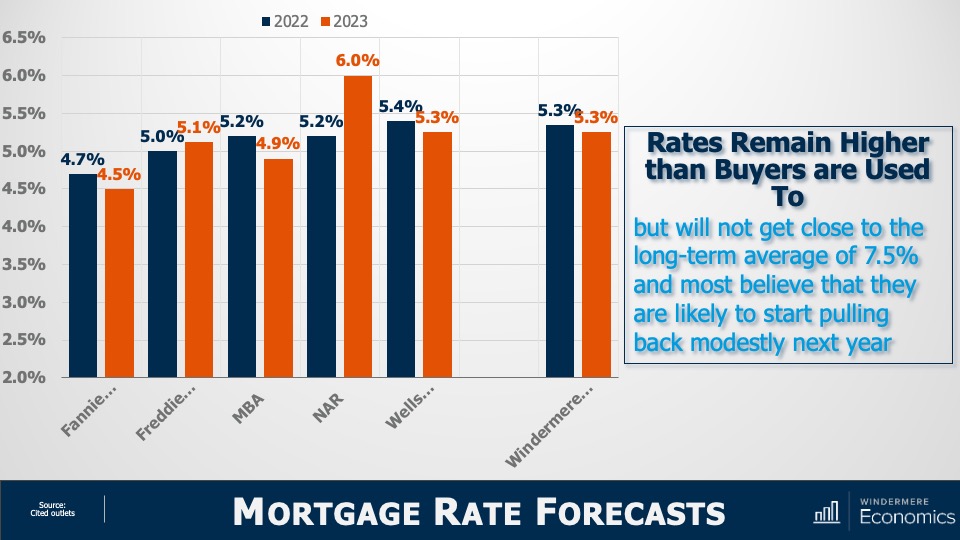
Mortgage Rate Forecasts
Image Source: Matthew Gardner
With mortgage rates doubling from their 2021 lows, downward pressure on sale price was to be expected. But will they—as some think—rise to a level that will cause home prices to plummet? To answer that, here are the forecasts of several associations. You’ll see that all, bar the National Association of Realtors and Freddie Mac, see rates pulling back—albeit modestly—in 2023.
Of course, all these are annual averages and today’s rates are higher with the latest Freddie Mac data showing the average 30-year fixed rate above 6%—a level we haven’t seen since 2008.
However, economists including myself find it unlikely that rates will continue rising significantly from where they are today. The mortgage market is certainly in a bit of disarray right now with the yield curve inverting, but that should correct itself by early next year and that’s why we generally expect rates to start pulling back from their current levels by the start of 2023.
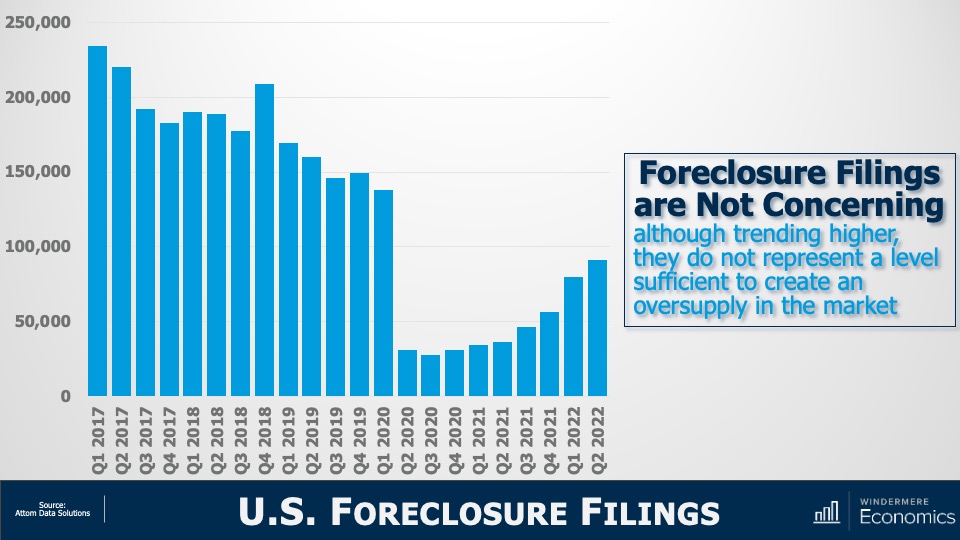
But if rising rates are triggering memories of 2008, you wouldn’t be alone. There are some expecting that the spike in rates will trigger a surge in foreclosures and that will doom the market. But as you see here, although foreclosure filings have certainly risen, they are still remarkably low compared to historic standards.
U.S. Foreclosure Filings
Image Source: Matthew Gardner
In the second quarter, newly delinquent mortgages represented just 1.9% of all mortgages outstanding1 and that’s the lowest share the market has seen since 2006. Although I do expect the number of homes being foreclosed on will rise as we move into 2023, I just don’t see it getting to the levels necessary to materially impact the market. And a big part of the reasoning behind my thinking is this:
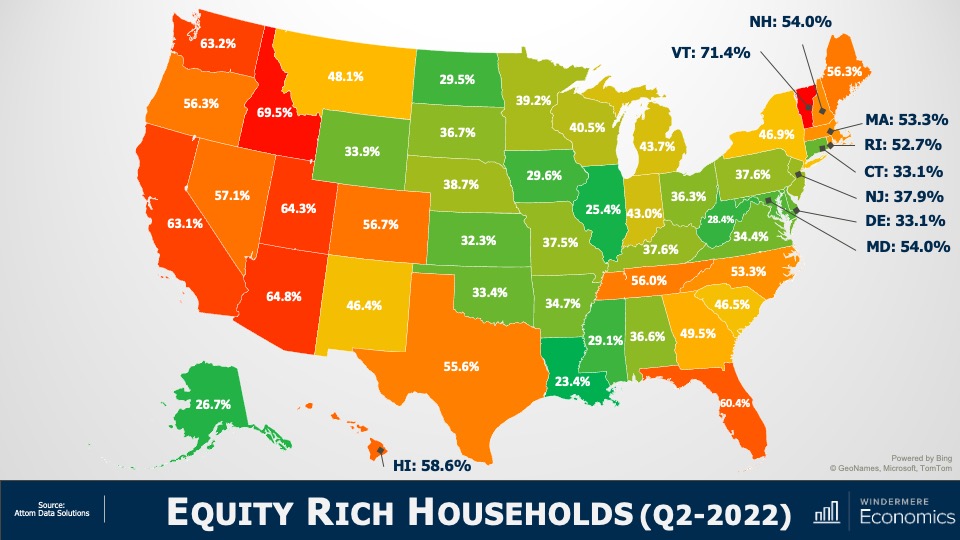
Equity Rich Households (Q2 2022)
Image Source: Matthew Gardner
In the second quarter of 2022, over 48% of homeowners with a mortgage were sitting on more than 50% equity.
Simply put, for enough homeowners to be put in a negative equity situation that would lead them to enter foreclosure and materially damage the market, home prices across the country would have to fall by a percentage greater than we saw during the market crash. And I just don’t see this happening.
The word “recession” has many connotations, and when it’s used to describe the housing market, it can engender a significant level of panic. So, I will ask you all. Given the data I have showed you today, do you think that we are in a housing recession?
Yes, supply levels have risen. But they are still relatively low when compared to historic averages and with builders slowing construction activity to a crawl, it’s unlikely that housing supply will grow much organically. Over the longer term, I believe that the supply of resale homes for sale will remain below historic averages. I say this for one simple reason: mortgage rates.
In 2020, a record number of households refinanced their homes to take advantage of the mortgage rates that had been plummeting. And in 2021, over six million home buyers got mortgages with rates averaging below 3%.
I would suggest to you that we will not see the number of homes for sale even get back to normalized levels in the mid-term, as many potential sellers will decide not to sell, because if they did, they would lose the never seen before and likely never to be seen again mortgage rate that they currently have.
Of course, there will be sellers who have to move because of factors such as job relocation, death, or divorce, but I would contend that listing activity may well be tight for a long time. And if supply remains below the level of demand, the market is further protected.
And as far as demand goes, let’s not forget that the age makeup of the country suggests that we will see a lot more potential buyers as Millennials and Generation Z mature, with current numbers suggesting significant buyer demand for the next two decades.
As for sale prices, I still believe (as do almost all economists) that the median home price next year will be higher than we will see this year, but a very significant drop in the pace of sales growth is likely as we trend down to historic averages.
Of course, all real estate is local and there are markets across the country that will see prices drop in absolute terms. But even in the most highly susceptible markets, it will be a temporary phenomenon. By 2024, homeowners in these markets will see the value of their homes start to rise again.
I’m going to leave you with my quote to describe today’s market today and it’s that we are in a “housing reversion,” NOT a housing recession.
As always, I’d love to hear your comments on my thoughts so feel free to reach out. In the meantime, stay safe out there and I’ll see you all again next month.
1: New York Fed Quarterly Report on Household Debt and Credit
About Matthew Gardner
As Chief Economist for Windermere Real Estate, Matthew Gardner is responsible for analyzing and interpreting economic data and its impact on the real estate market on both a local and national level. Matthew has over 30 years of professional experience both in the U.S. and U.K.
In addition to his day-to-day responsibilities, Matthew sits on the Washington State Governors Council of Economic Advisors; chairs the Board of Trustees at the Washington Center for Real Estate Research at the University of Washington; and is an Advisory Board Member at the Runstad Center for Real Estate Studies at the University of Washington where he also lectures in real estate economics.
Once you and your agent work through the process of selling your home, there comes a point when it’s time to switch gears and get ready to move. It can be difficult to juggle the various steps of the moving process, especially if you’re Buying and Selling a Home at the Same Time. Using a moving checklist will help you stay organized and on schedule throughout your moving timeline.
Moving Checklist: A Step-by-Step Guide to the Moving Process
We’ve included a comprehensive checklist below of all the steps you’ll need to complete to ensure a smooth, successful move. This list is also available as an interactive web page and downloadable PDF here: Moving Checklist
Twelve Weeks Before:
Get estimates from professional movers or truck rental companies if needed.
Once you’ve selected a mover, discuss insurance, packing, loading and delivery, and the claims procedure.
Six to Eight Weeks Before:
Use up things that may be difficult to move, such as frozen food.
Sort through your possessions. Decide what you want to keep, what you want to sell, and what you wish to donate to charity.
Record serial numbers on electronic equipment, take photos (or video) of all your belongings and create an inventory list.
If you are moving yourself, use your inventory list to determine how many boxes you will need. Stock up on the items you’ll need from our “Moving Essentials” list.
Obtain a change of address packet from the post office and send it to creditors, magazine subscription offices, and catalog vendors.
Discuss tax-deductible moving expenses with your accountant and begin keeping accurate records.
If you’re moving to a new community, contact the Chamber of Commerce and school district and request information about services.
Make reservations with airlines, hotels, and car rental agencies, if needed.
Begin packing nonessential items.
Two to Four Weeks Before:
Arrange for storage, if needed.
If you have items you don’t want to pack and move, hold a yard sale.
Update the address listed on your car registration, license, and insurance.
Transfer your bank accounts and safe-deposit box items to new branch locations if needed. Cancel or redirect any direct deposit or automatic payments from your accounts.
Make special arrangements to move your pets and consult your veterinarian about ways to make travel comfortable for them.
Have your car checked and serviced if you’ll need to drive it a long distance.
Change your utilities, including phone, power, and water, from your old address to your new address.
Week of Moving Day:
Defrost your refrigerator and freezer.
Have movers pack your belongings.
Label each box with the contents and the room where you want it to be delivered.
If you’re using a moving company, arrange to pay for their services in full, or the remainder of what you owe, upon delivery.
Set aside legal documents and valuables that you do not want packed.
Pack clothing and toiletries, along with extra clothes in case the moving company is delayed.
Give your travel itinerary to a close friend or relative so they can reach you as needed.
Pack a first-day box with items that you’ll want accessible before other boxes are unpacked. See our list of suggested items on the right and add any others you’ll want to include.
Moving Day:
Old Home
Pick up the truck as early as possible if you are moving yourself.
Make a list of every item and box loaded on the truck.
Let the mover know how to reach you.
Double-check your closets, cupboards, attic, basement, yard, and garage for any left-behind items.
New Home
Be on hand at the new home to answer questions and give instructions to the mover.
Check off boxes and items as they come off the truck.
Install new locks.
Confirm that the utilities have been turned on and are ready for use.
Unpack your first-day box.
Unpack your children’s toys and find a safe place for them to play.
Examine your goods for damage.
Our Moving Checklist page has all the information above, plus helpful lists for Moving Essentials and which items to pack in your First-Day Box available as a downloadable PDF.
This video is the latest in our Monday with Matthew series with Windermere Chief Economist Matthew Gardner. Each month, he analyzes the most up-to-date U.S. housing data to keep you well-informed about what’s going on in the real estate market.
Hello there, I’m Windermere’s Chief Economist Matthew Gardner and welcome to this month’s episode of Monday with Matthew. Today we are going to take a look at the new home market where headwinds are certainly growing. And the reason this particular subject piqued my interest was that the National Association of Home Builders just released their Housing Market Index for August, and the numbers were certainly eye-opening.
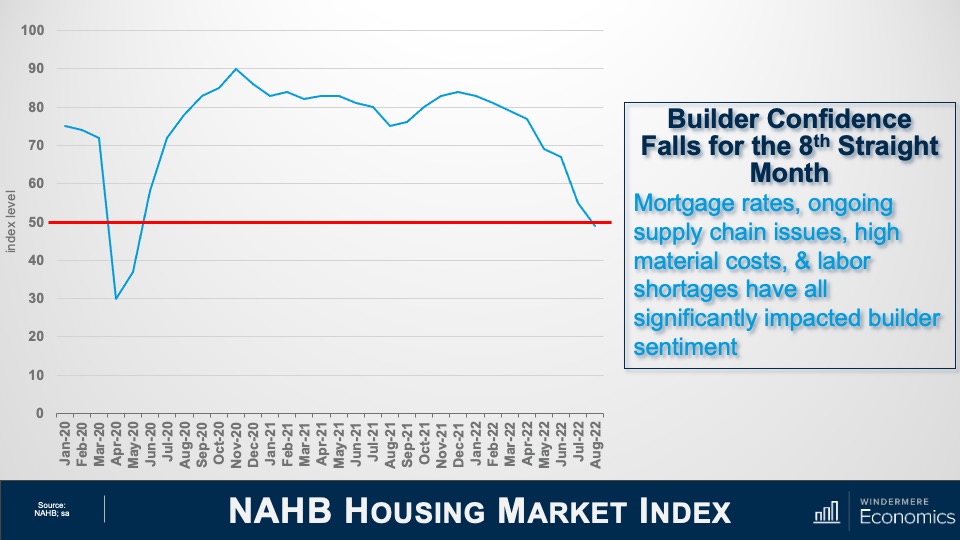
Now, for those of you who may not be particularly familiar with this index, it is based on a survey of home builders which asks them to give their opinions on the single-family home market and asks them to rate current market conditions for the sale of homes today as well as in six months’ time. It also asks their opinion regarding foot traffic of prospective buyers to their new home communities.
NAHB Housing Market Index
And as you can see, the headline index level fell six points to 49. The drop in August marked the eighth consecutive monthly decline for the Housing Market Index. It was also notable because it was the first time since May of 2020 that the index has dropped below the key 50 breakeven level. This is significant, as it tells us that today more home builders currently rate sales conditions as poor than good.
Now, while the August number was certainly lower than some economists had forecast, I was actually not too surprised as builders have been reporting a spike in cancelled contracts recently. In fact, a report I just read that was put out by John Burns Consulting suggested that the cancellations have more than doubled since April with 17.6% of buyers pulling out of their purchases in July. That compares to 8% in April and 7 ½% a year ago.
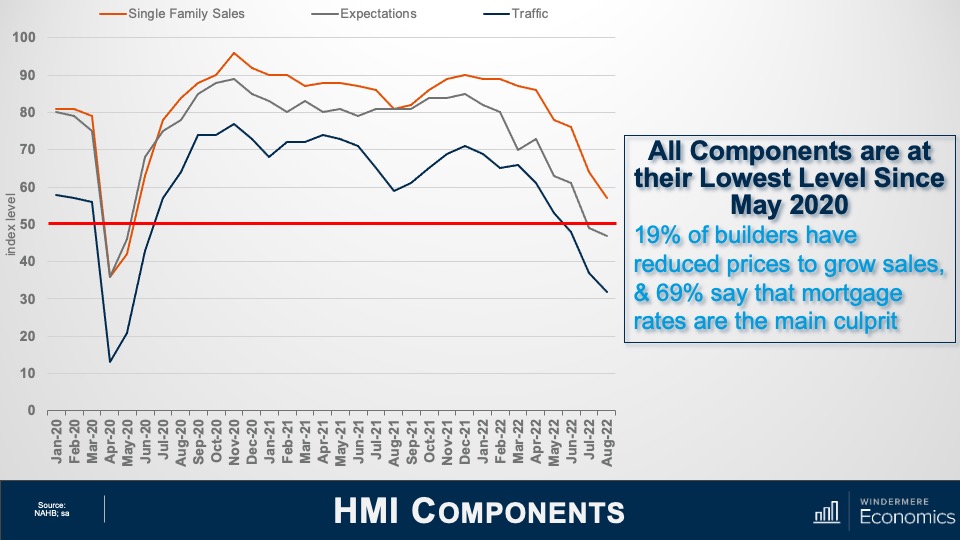
Housing Market Index Components
This chart shows a breakdown of three components of the Housing Market Index which are all at their lowest levels since May of 2020, which was just before housing activity rebounded following the lockdown due to COVID-19.
The present sales index fell seven points to 57 but is still above the breakeven point
The future sales series fell two points to 47
Prospective buyer traffic fell five points to 32 which, if we exclude the pandemic, represents the lowest index level since April of 2014
I find this index has a very strong correlation with new home sales, but I also use it as a pretty reliable leading indicator when it comes to single-family housing starts. I’ll get to that shortly. The survey also stated that one in five builders had reduced prices in August. That might help to explain the 10-point spread between builders’ perception of current versus future sales. But there are limits on home builders’ ability to keep cutting prices in order to support sales. This has become a significant issue because many of them are currently holding a large stock of inventory.
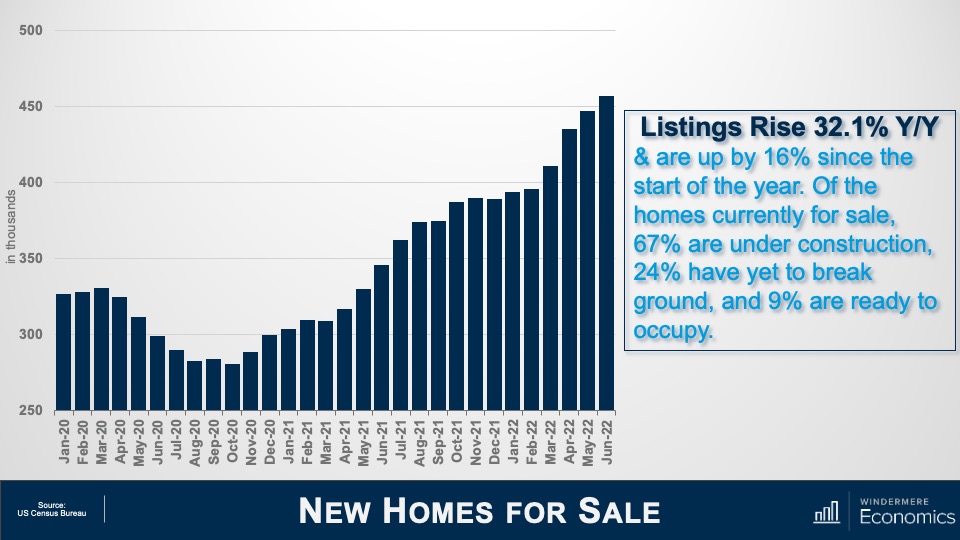
New Homes for Sale
Here is what current inventory levels look like. Although you might think that it’s not that bad given that only 9% of available homes are finished are ready to move into, I would tell you that builders incur costs every day that a home is not sold, even if that home has yet to be built. And with inventory at a level not seen since 2008, I’m sure there are a lot of builders not sleeping too well right now.
I would add that by the time the above video is released, the July new home sales report will have been published. I can almost guarantee that the number of homes for sale will have grown further.
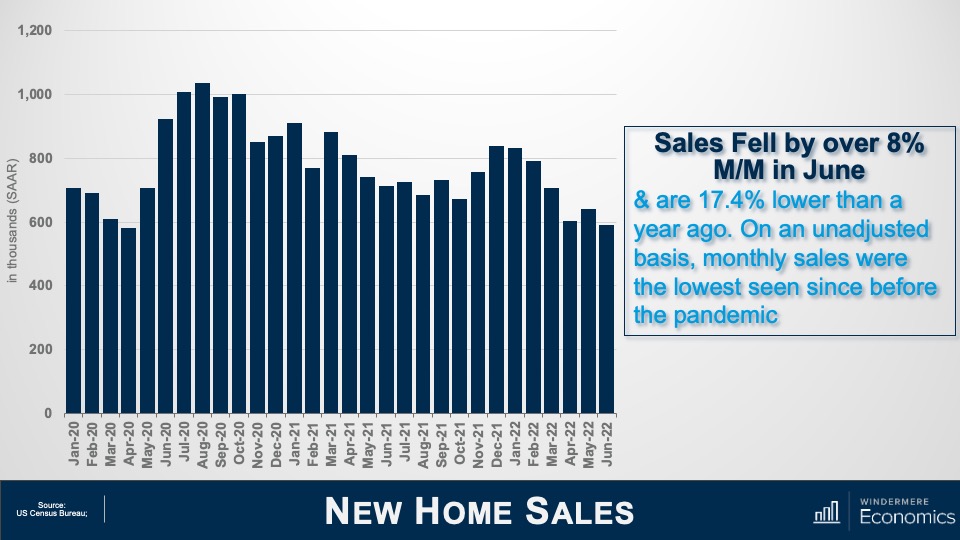
New Home Sales
Higher inventory levels are due to slower sales activity, which is continuing to decline. Sales are 17% lower than a year ago. With more homes for sale and lower transactions, it would now take more than nine months to absorb all available homes using the current sales pace. I would also tell you that the last time months of supply broke above nine was all the way back in 2010.
It’s my forecast that sales in July will have dropped from the annualized rate of 590,000 shown in the chart above to somewhere between 570,000 and 580,000.
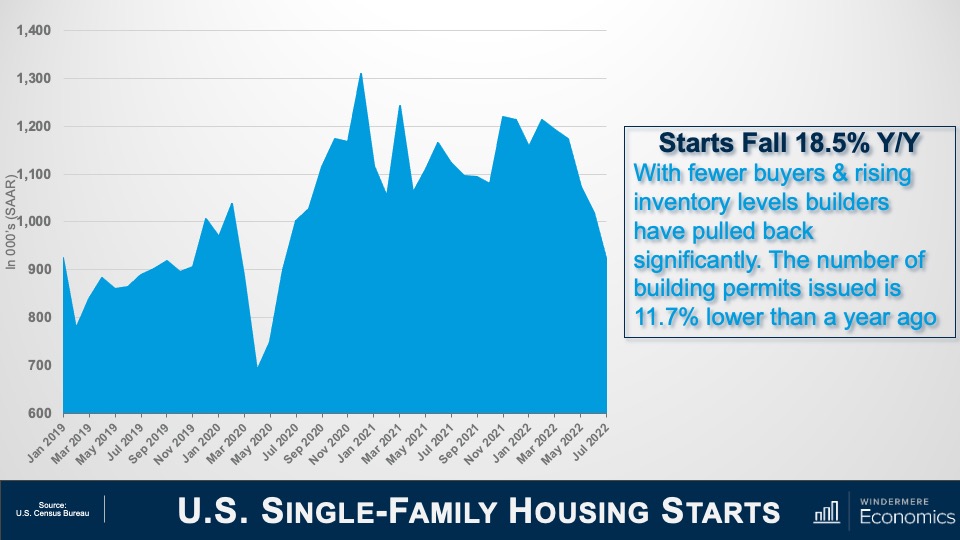
U.S. Single-Family Housing Starts
With high supply levels and lower sales, it’s not at all surprising to see builders hitting the brakes, with new home starts falling by 10.1% between June and July of this year. Starts are down by 18 ½% from a year ago. Starts have dropped on a sequential basis for five consecutive months now, and I am afraid that they will drop further before finding a bottom.
So, what’s the bottom line here? Well, there are several issues I see, the first of which is affordability. Home prices have been spiraling upward since the start of the pandemic not only because mortgage rates dropped, but construction costs started jumping and builders had to charge more for a home.
Builders saw prices rise by almost 18% last year. This had already taken a significant toll on affordability even before the mortgage rates spike we saw earlier this year. The upshot, as I see it, is that tighter monetary policy from the Fed, in concert with construction costs that remain well above normal levels, has hit builders and hit them hard. Of course, they are doing their best to address the situation by slowing construction activity significantly, but I think that they are going to have a pretty rough time for the next several months.
Ultimately, I see little option for home builders other than lowering prices further, especially now that they are competing with rising inventories in the resale market. I also believe that there are buyers out there waiting patiently on the sidelines for prices to drop in the coming months as they know that builders at some point have to solve the current supply demand imbalance and lowering prices is the easiest way of doing this. Last month the average price drop was 5%, but this is very likely to increase as we move toward the fall.
Will builders get through the situation they find themselves in? I believe that they will. And there are some glimmers of light out there with inflation appearing to be peaking, interest rates are, if not dropping, then certainly stabilizing, and this will help.
Builders also understand that the country has a significant housing shortage. In fact, a recent report published by “Up For Growth” suggested that we have a housing shortage today of around 3.8 million homes. Although this includes rental and ownership housing, some basic math tells me that there is a need today for around 2.5 million new owner-occupied homes. So, light is definitely at the end of the tunnel, but there is a way to go before they get out of it.
And there you have it. I hope that you’ve found my thoughts on this topic of interest. As always, if you have any questions or comments about the current new home environment, please do reach out to me. In the meantime, stay safe out there and I look forward to visiting with you all again next month.
Bye now.
About Matthew Gardner
As Chief Economist for Windermere Real Estate, Matthew Gardner is responsible for analyzing and interpreting economic data and its impact on the real estate market on both a local and national level. Matthew has over 30 years of professional experience both in the U.S. and U.K.
In addition to his day-to-day responsibilities, Matthew sits on the Washington State Governors Council of Economic Advisors; chairs the Board of Trustees at the Washington Center for Real Estate Research at the University of Washington; and is an Advisory Board Member at the Runstad Center for Real Estate Studies at the University of Washington where he also lectures in real estate economics.
The mid-century modern movement’s impact on design reaches far and wide. Whether it’s graphic design, architecture, interior design, product development or elsewhere, we see traces of its influence in countless aspects of everyday life today. Mid-century modern homes are known for their signature look and stylistic appeal. Here’s a short guide to understanding the characteristics behind mid-century modern architecture.
Mid-Century Modern Design
Yes, mid-century modern interior design and mid-century modern architecture are two separate things. The interior design style emphasizes clean lines and minimal decoration, the use of natural elements as accents, and a base of neutral colors for decorating. MCM interior design can exist in any type of home regardless of its architectural style, and is often a popular source of inspiration for decorators fond of vintage elements and popular mid-century furniture pieces such as credenzas, teak desks, Eames chairs, etc.
What is Mid-Century Modern Architecture?
Mid-century modern architecture is the exterior counterpart of its interior design branch. Fueled by a massive need for suburban homes throughout the Unites States in the post-World War II era, the stage was set for mid-century modern’s introduction to the masses. Some of the greatest minds in modern architectural history helped develop and proliferate its presence in society, including Ludwig Mies van der Rohe and Frank Lloyd Wright. Though you’ll find unique variations within mid-century modern, there are certain tenets of the architectural style.
Mid-century modern homes have flat roofs with straight lines. This clean geometric approach in roof design is part of a larger philosophical ideal that these homes should blend in with their outdoor environments, thereby working in harmony with nature.
Glass is used heavily, and floor-to-ceiling windows are a common feature, especially in the living room.
The minimalist approach to exterior design is showcased in the easy access to outdoor spaces and the fact that mid-century modern homes are often one-story buildings.
The open spaces created by this architectural style allow for intentional decorating and the use of color splashes to bring energy into them. Mid-century modern interiors often incorporate vibrant, warm colors on top of a calmer, neutral foundation.
The following analysis of select counties of the Utah real estate market is provided by Windermere Real Estate Chief Economist Matthew Gardner. We hope that this information may assist you with making better-informed real estate decisions. For further information about the housing market in your area, please don’t hesitate to contact your Windermere Real Estate agent.
Regional Economic Overview
The Utah economy remains buoyant. Although the pace of job growth has tapered somewhat from 2021, jobs continue to be added faster than the long-term average. Over the past 12 months, the state has added 55,400 jobs, representing a growth rate of 3.4%. The counties covered in this report added almost 53,000 new jobs over the past year, representing a growth rate of 4%. The state’s unemployment rate in May was 2%, which is marginally above the all-time low of 1.9% in April of this year. The labor force continues to expand, suggesting that the region expects economic growth to remain strong. All in all, a very impressive situation.
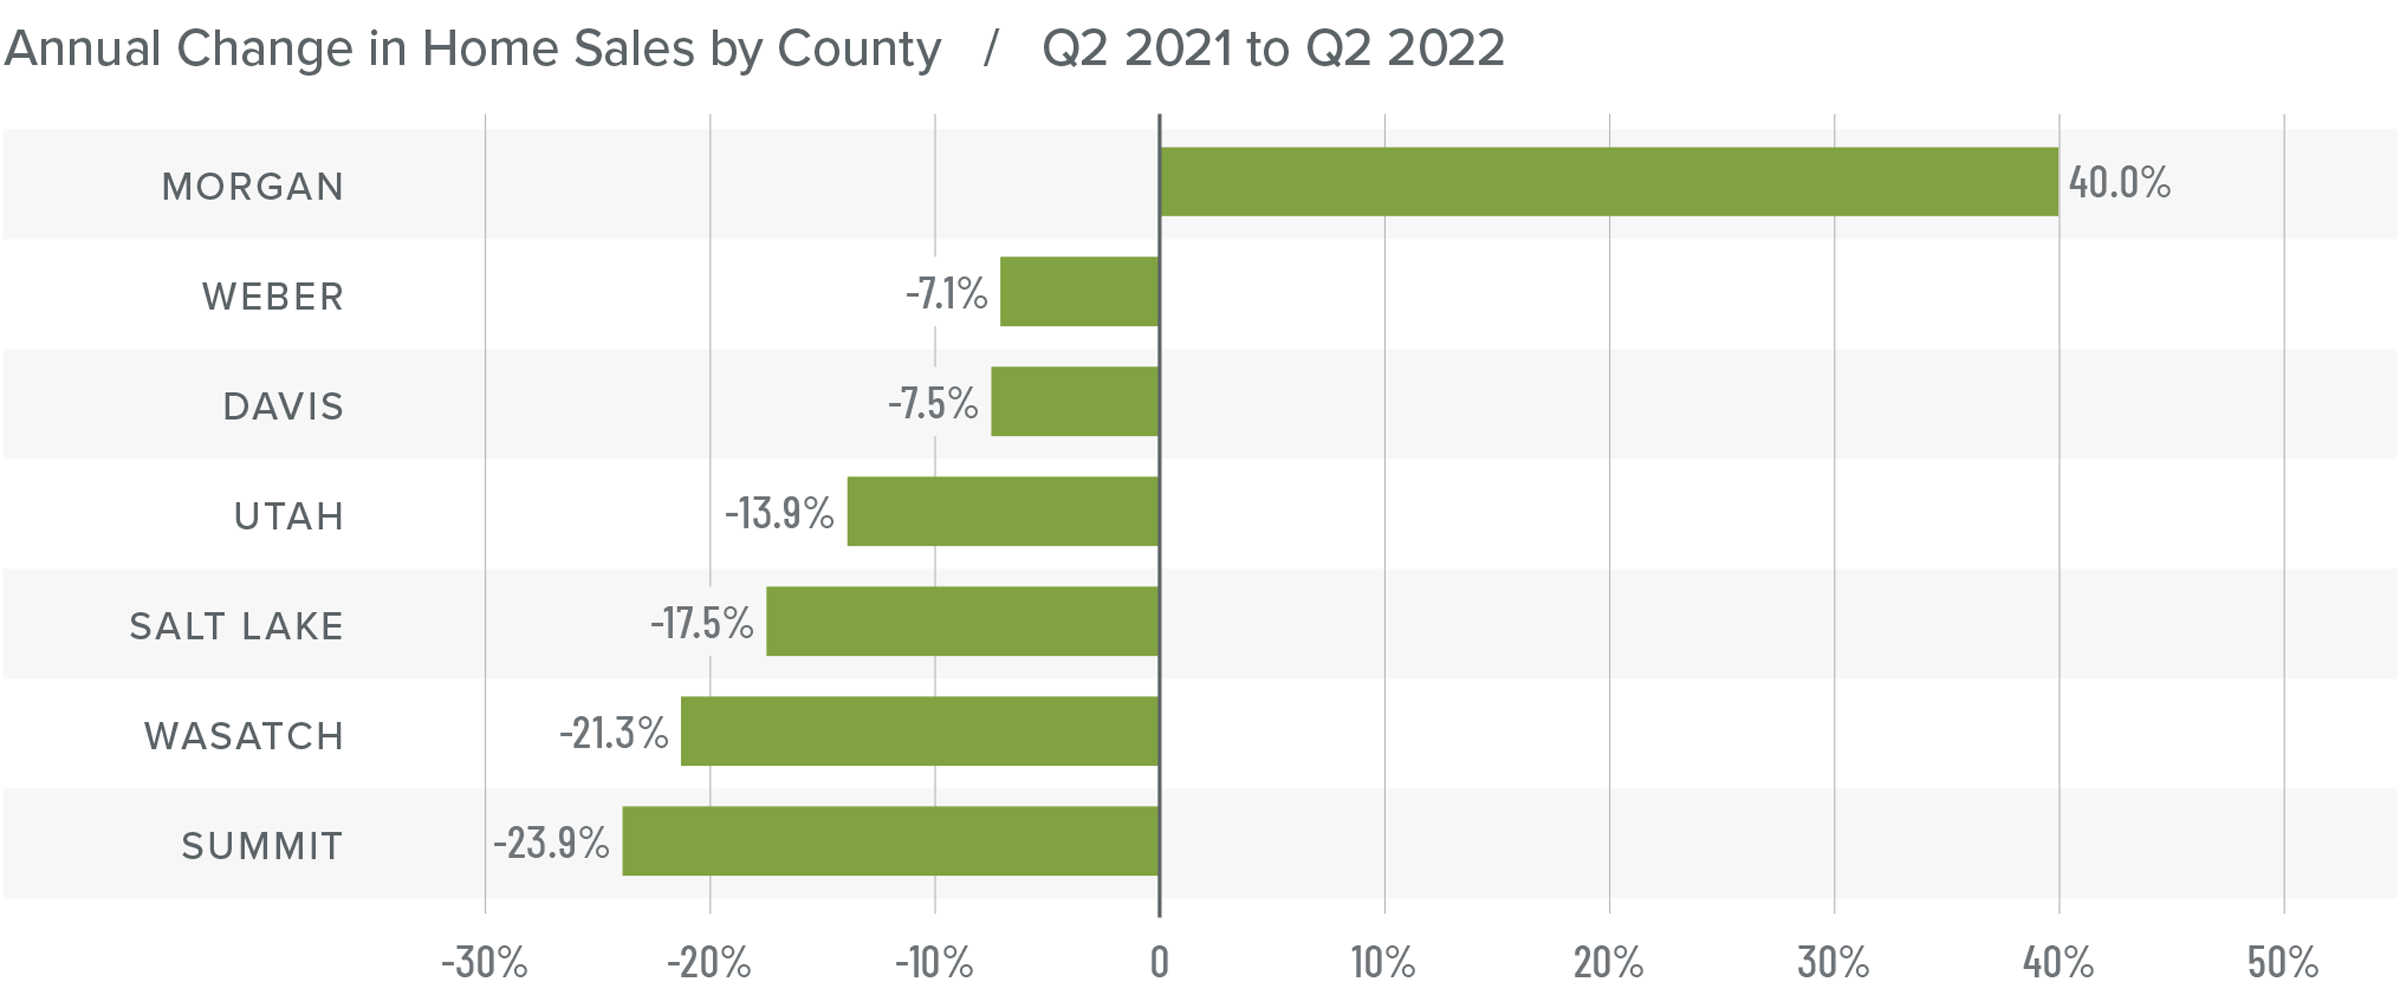
Utah Home Sales
❱ In the second quarter of 2022, 8,501 homes sold, which was a drop of 14.4% year over year. Sales were 30.9% higher than in first quarter of the year.
❱ Year over year, sales rose in the small Morgan County area but fell in the rest of the markets included in this report. Conversely, sales rose across the board compared to the first quarter, with impressive growth in Morgan, Davis, Utah, and Salt Lake counties.
❱ Inventory levels, which had been remarkably low, rose 206.2% from the first quarter of the year. This clearly had a positive effect on the market as more choice for buyers led to more sales.
❱ Buyers appeared to shrug off the fact that mortgage rates rose more than 1.5% in the quarter, which suggests they still believe owning a home is a solid investment.
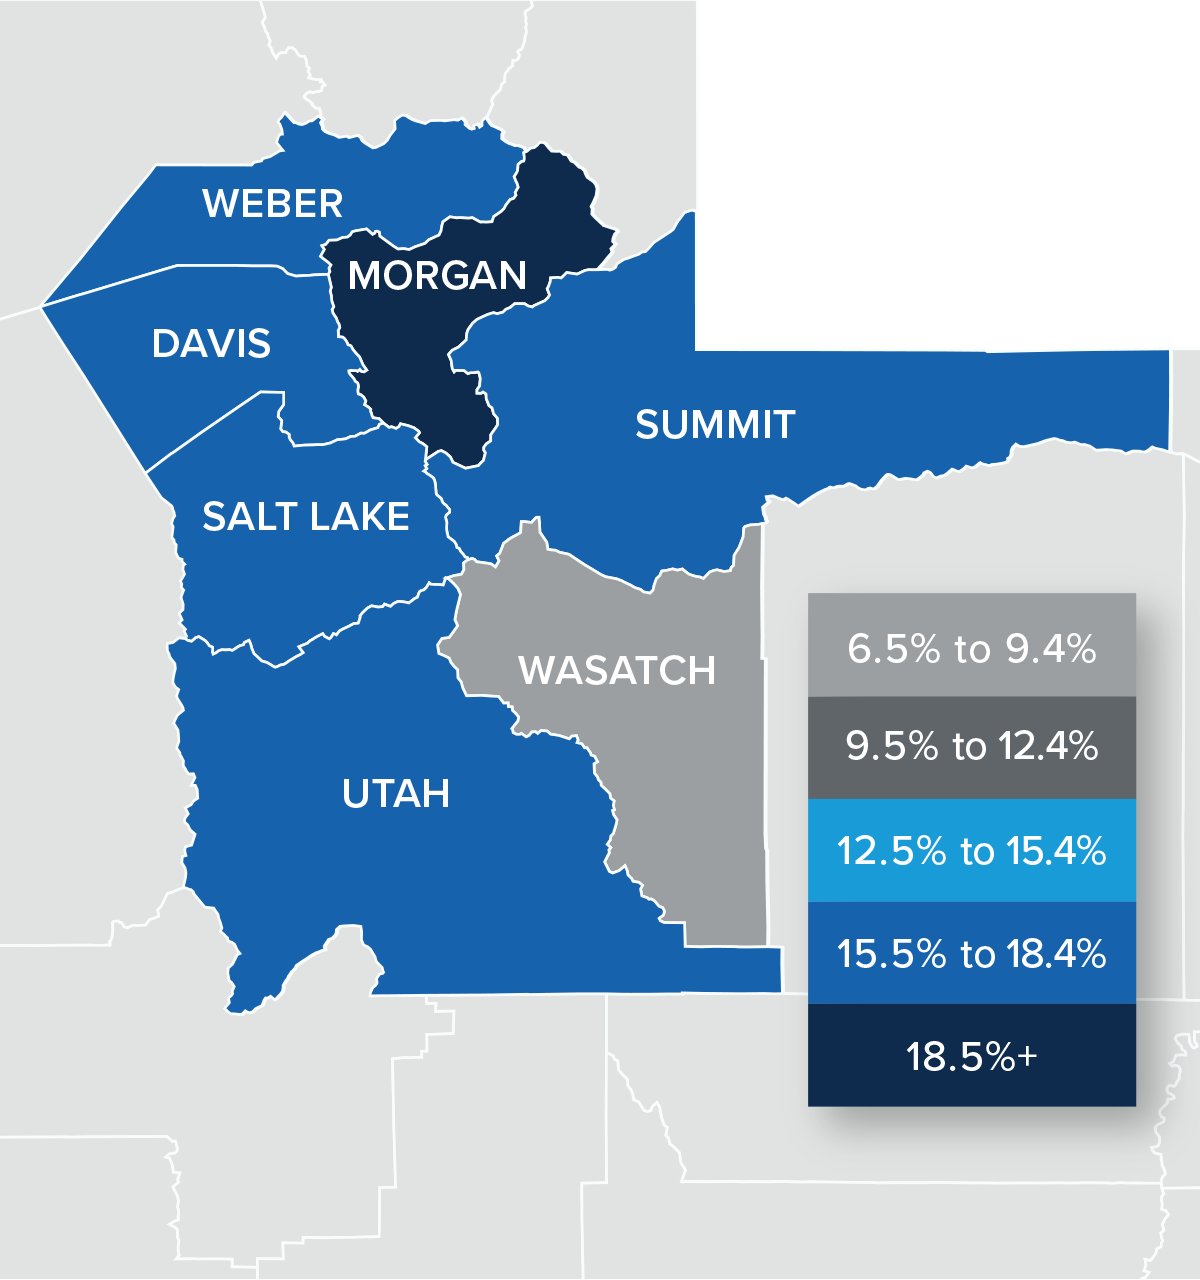
Utah Home Prices
❱ Even with more homes on the market, prices continued to rise. Home prices rose 15.4% year over year to an average of $665,697, and they were 4.2% higher than in the first quarter of 2021.
❱ I have started watching list prices, as they will be a leading indicator of whether the market is starting to feel the impacts of declining affordability due to rising financing costs. In the second quarter, the median list price in the region dropped 2.2%, but it rose in Morgan, Davis, and Salt Lake counties.
❱ All areas contained in the report except for Wasatch County saw sale prices increase by double digits compared to a year ago. Compared to the first quarter of this year, prices were higher in every county other than Summit.
❱ Higher financing costs combined with declining affordability may have started to slow the rapid pace of appreciation we’ve seen over the past two years. This is nothing to be concerned about; rather it suggests that the market is starting to return to some sense of normalcy.
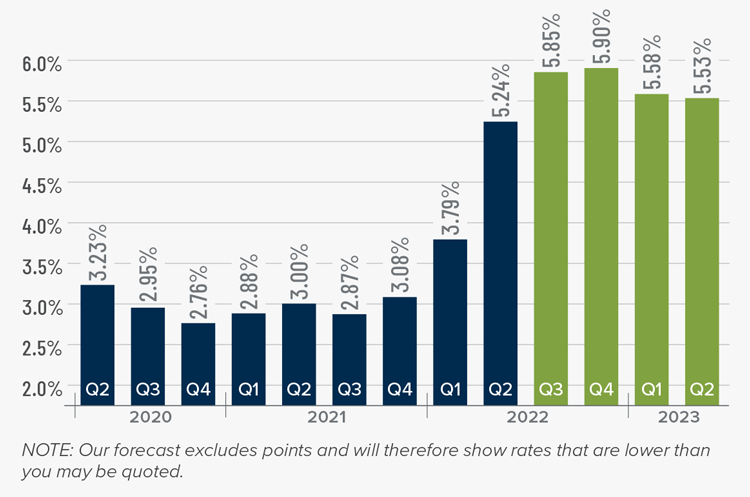
Mortgage Rates
Although mortgage rates did drop in June, the quarterly trend was still moving higher. Inflation—the bane of bonds and, therefore, mortgage rates—has yet to slow, which is putting upward pressure on financing costs.
That said, there are some signs that inflation is starting to soften and if this starts to show in upcoming Consumer Price Index numbers then rates will likely find a ceiling. I am hopeful this will be the case at some point in the third quarter, which is reflected in my forecast.
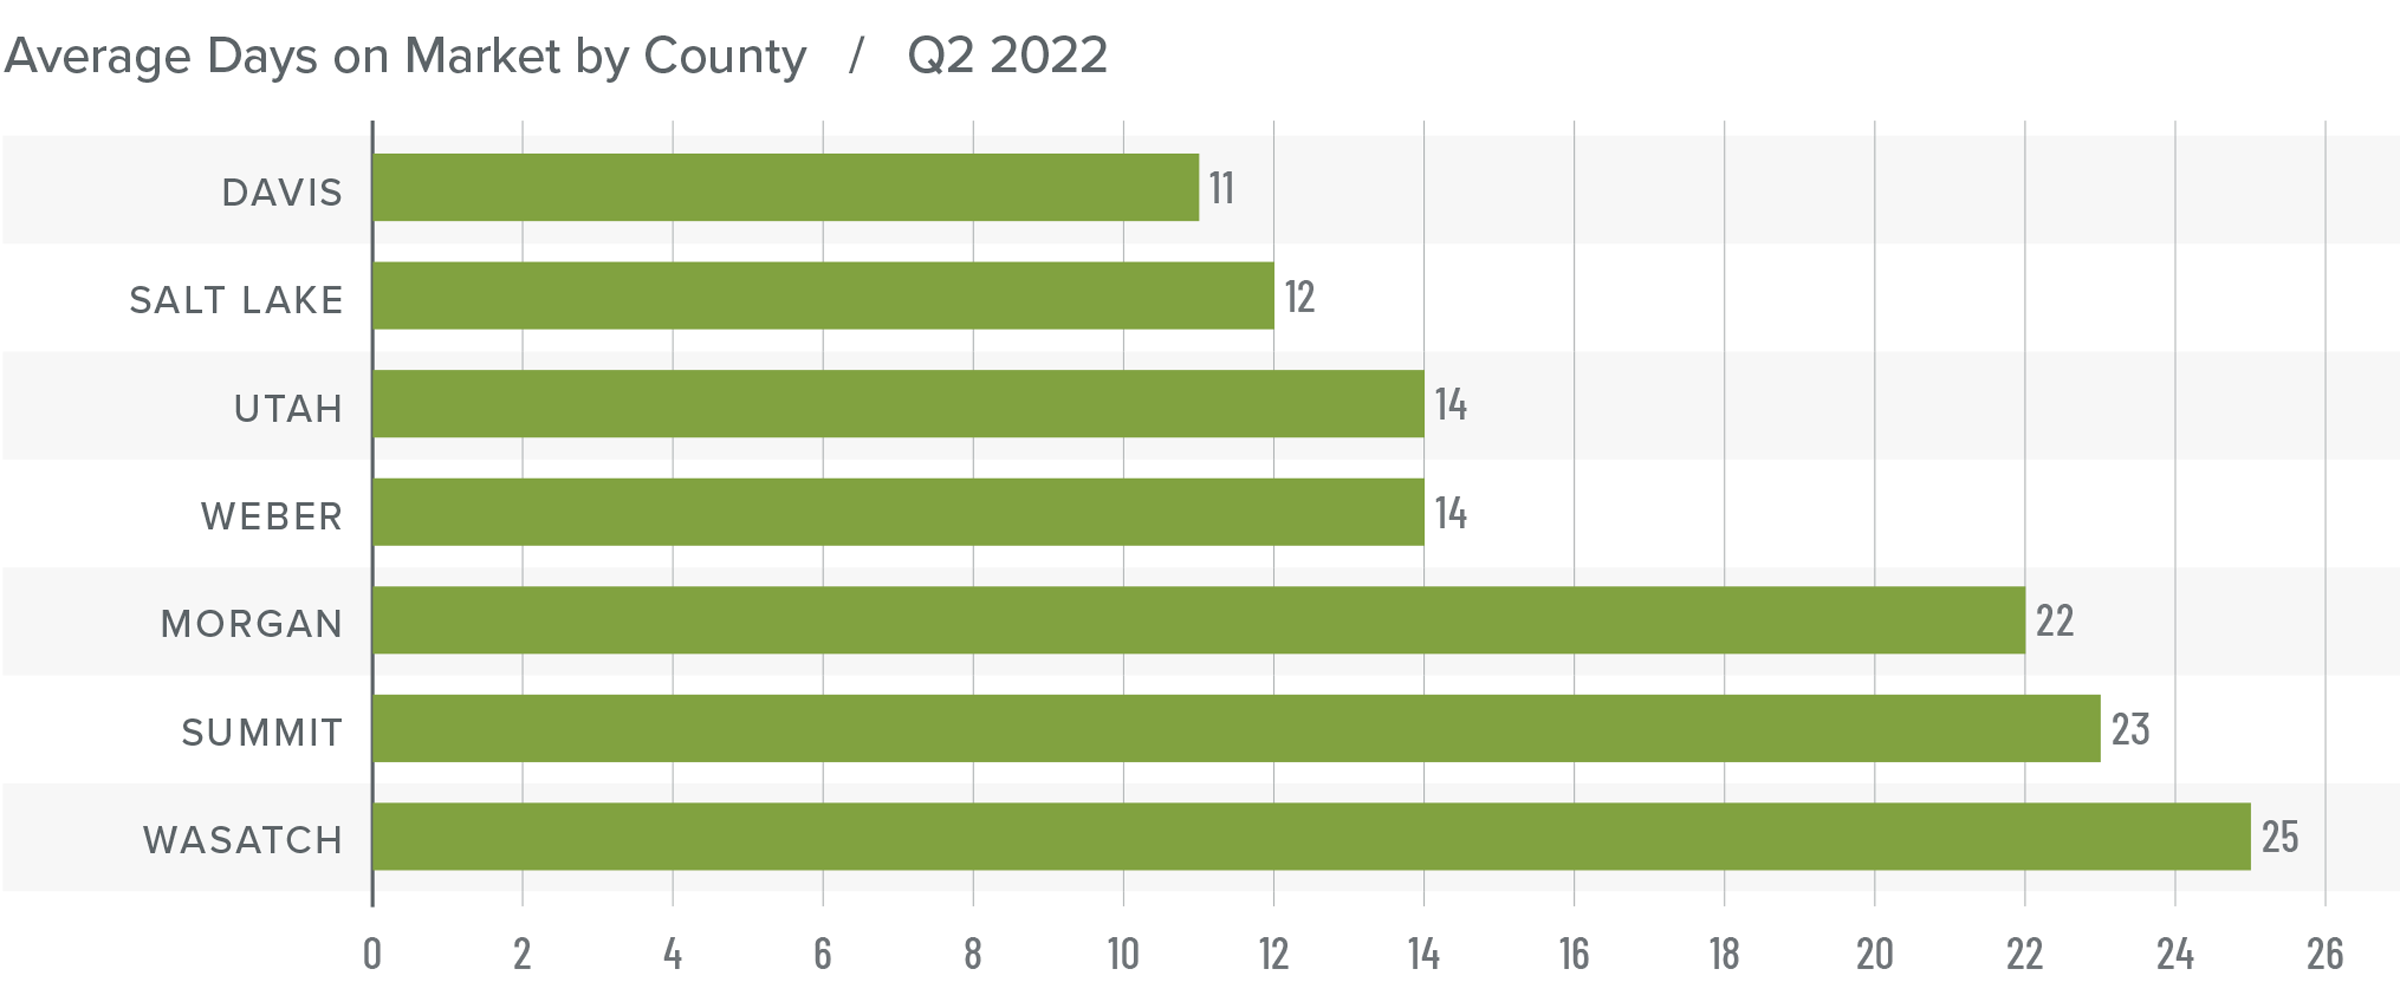
Utah Days on Market
❱ The average time it took to sell a home in the counties covered by this report dropped two days compared to the same period a year ago.
❱ Homes again sold fastest in Davis County, and every county except Summit and Wasatch saw average time on market rise compared to a year ago. The greatest drop in market time was in Summit County, where it took 19 fewer days to sell a home.
❱ During the second quarter, it took an average of 17 days to sell a home in the region. Not only did market time fall year over year, but it took 8 fewer days for homes to sell compared to first quarter.
❱ The market remains very competitive and, as mentioned earlier, appears to not yet be impacted by higher mortgage rates.
Conclusions
This speedometer reflects the state of the region’s real estate market using housing inventory, price gains, home sales, interest rates, and larger economic factors.
The number of homes for sale in Utah has risen significantly and buyers are absorbing the additional supply. That said, higher inventory levels are forcing sellers to be a little more competitive than they were, as demonstrated by declining median list prices in several areas. I would contend that the market is not headed for any sort of correction; rather it has started to trend back to some sense of normalcy. This may be concerning to those who have become accustomed to the frenetic pace the market has experienced since the start of the pandemic, but it really is nothing to worry about.
Sellers still have the upper hand and well-positioned, appropriately-priced homes continue to attract significant interest from buyers. Given all the data discussed in this report, I have left the needle in the same position as the last quarter. Although the market still favors sellers, a shift may be on the way that would lead us toward a more balanced market.
About Matthew Gardner
As Chief Economist for Windermere Real Estate, Matthew Gardner is responsible for analyzing and interpreting economic data and its impact on the real estate market on both a local and national level. Matthew has over 30 years of professional experience both in the U.S. and U.K.
In addition to his day-to-day responsibilities, Matthew sits on the Washington State Governors Council of Economic Advisors; chairs the Board of Trustees at the Washington Center for Real Estate Research at the University of Washington; and is an Advisory Board Member at the Runstad Center for Real Estate Studies at the University of Washington where he also lectures in real estate economics.
After setting a goal to reach $50 million in total donations in honor of Windermere’s 50th anniversary, the Windermere Foundation is getting closer to reaching that goal thanks to the $1.5 million that has been raised so far this year. After ending last year with a grand total of over $46 million in donations, that leaves roughly $2.5 million to hit our goal by the end of 2022. Here are some recent examples of how our offices have been raising money and helping low-income and homeless families in their communities via the Windermere Foundation.
Windermere Wedgwood
The Windermere Wedgwood office was inspired to support Lutheran Community Services—a local response organization helping refugees to find stability in the Pacific Northwest—after learning that they needed help raising money to support incoming families of Afghan refugees. After discussing the situation with Windermere Foundation Representatives from the Northgate, Sand Point, Madison Park, Eastlake, and Ballard offices, they got to work spreading the news and gathering donations. Support poured in, and when a check for $15,125 was presented to LCS, there were tears of joy.
Windermere Coast Offices
For the past ten years, the Windermere Coast offices of Gearhart and Cannon Beach, Oregon have participated in the Autism Society of Oregon – Clatsop Chapter’s 5k race/fundraising event “Color the Coast for Autism” as a way to support families with children on the autism spectrum. This year not only did the offices participate and donate $1,000, but they placed well in the race, too! Agent Katy Walstra Smith came in first place for the 5k relay, with two other agents placing inside the top 20.
Pictured L to R: Dennis O’Reilly, Cynthia O’Reilly, Katy Walstra Smith, Pam Ackley, Tobi Rates, and Brandi Lindstrom – Image Source: Pam Ackley
Windermere West Campus
Observed in April, Sexual Assault Awareness Month (SAAM) is an annual campaign to raise public awareness about sexual assault and educate communities and individuals on how to prevent sexual violence. Windermere West Campus of Federal Way, Washington directed their recent Windermere Foundation efforts toward supporting the King County Sexual Assault Resource Center by donating $1,500 to support the center’s family service programs.
Windermere Bozeman-Downtown
The Windermere Bozeman-Downtown office continues to support and spread goodwill throughout the Bozeman community. In April, they hosted a Windermere Week of Giving for five local organizations that resulted in $1,000 donations to each.
Their donation to Thrive will go toward hiring mentors for two children for an entire school year. The funds allocated to Eagle Mount paid for some of the production costs for their largest annual fundraiser, which the Bozeman staff helped put on during Community Service Day 2022. Their donation to Haven will be used to provide resources to victims of domestic and/or sexual abuse. Family Promise plans to use the funds to support families experiencing homelessness in Gallatin County. And the donations to HRDC will go toward the establishment of a new facility to provide resources and solutions to people experiencing poverty in the area.
Pictured L to R: Aidan Young, Kelly Martin, Mike Stem, Andrew Flakker, Natalie McDonald – Image Source: Natalie McDonald
Pictured L to R: Kim Stevens, Erica Coyle, Kevin Schwartz, Bobby Goodman
Windermere Mercer Island
Every year, the Windermere Mercer Island office hosts a shredding event which draws crowds of clients and community members alike. This year, they hired a local shredding company to bring a truck to the office parking lot and invited the community to safely and securely shred their old documents while getting a chance to meet some of their fellow community members. The event also served as a platform to collect donations for and raise awareness about the Windermere Foundation’s 50 in 50 campaign.
Windermere Walla Walla
In May, Windermere Walla Walla held a cartoon-themed bowling night to raise money for the local YWCA, the Christian Aid Center, and Children’s Home Society. Agents, staff, and community members came dressed as cartoon characters of all kinds, which made for a colorful and lively scene at the local bowling alley. All in all, Walla Walla collected a whopping $10,000 to support the YWCA’s resources for local women in need, the Children’s Home Society’s child and family counseling, and the Christian Aid Center’s efforts to provide emergency shelter for the Walla Walla homeless population.
This video is the latest in our Monday with Matthew series with Windermere Chief Economist Matthew Gardner. Each month, he analyzes the most up-to-date U.S. housing data to keep you well-informed about what’s going on in the real estate market.
Hello there, I’m Windermere’s Chief Economist Matthew Gardner and welcome to this month’s episode of Monday with Matthew. You know, one of the many things I love about being an economist is that it is a remarkably humbling profession. You see, just when we start to believe that our models are close to perfection, something comes along to remind us that forecasting isn’t an exact science.
And if you’re wondering what I am talking about, I recently took a look at the 2022 mortgage rate forecast I put out at the start of the year and…well, let’s say that rates rose at a far faster pace than I had anticipated. I thought that now would be a good time to take another look at rates and share my thoughts on the direction that they will likely take during the rest of the year and my reasoning behind it. And that means we need to talk about inflation.
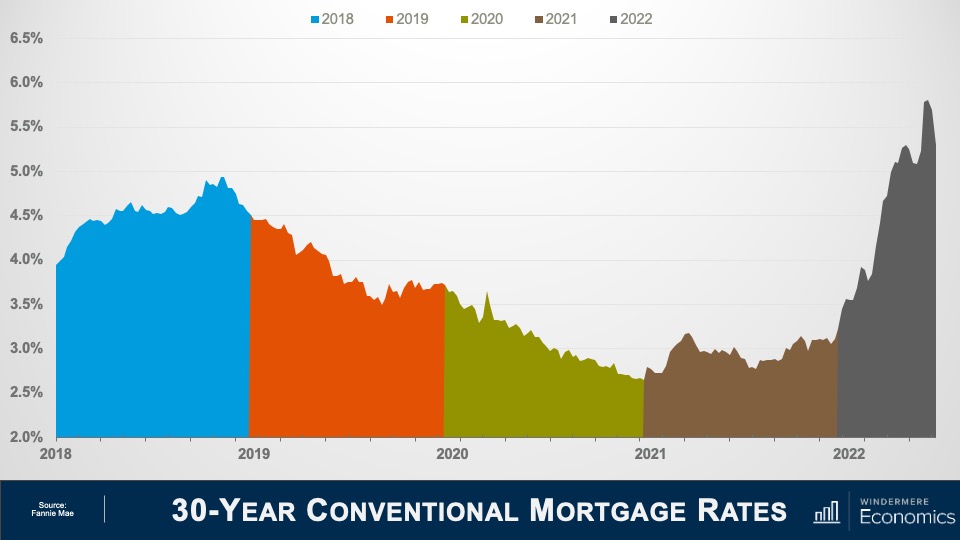
30-Year Conventional Mortgage Rates: 2018 – 2022
So, a quick look back. As you can see, there wasn’t much to celebrate in 2018, with rates rising from 3.95% to 4.94% before pulling back and ending the year at around 4.5%. In 2019, rates fell following the Feds’ announcement that they were likely done with raising the Fed Funds Rate, and the mortgage market also reacted positively to the announcement from the White House that they were going to impose tariffs on select Chinese imported goods. We saw an uptick in late summer, but that was mainly due to news related to BREXIT.
In 2020, rates were dropping but spiked very briefly when COVID-19 shut the country down and bond markets panicked. But with the Fed jumping in with an emergency rate cut and announcing that they would start buying a significant number of treasuries and mortgage-backed securities, rates tumbled to an all-time low of just 2.66%. In 2021, rates rose as new COVID infections plummeted, but then dropped again as the Delta variant took hold, but ultimately trended modestly higher in the second half of the year.
And then we get to 2022. Rates started the year at just over 3.1% but have since skyrocketed to over 5.8% before a small pullback that started a few weeks ago. In as much as economists expected rates to rise this year, nobody anticipated how fast they would rise. So, what went wrong? Well, there’s actually a rather simple answer.
Even though we expected rates to trend higher in 2022, there were two things we hadn’t built into our forecast models.
Russia’s invasion of the Ukraine
Inflation continued to climb for far longer than we expected
So, how do things look for the rest of the year? To explain my thinking, it’s important to remember that the bond market and, by implication, mortgage rates hate nothing more than high inflation because when inflation is running hot, it limits demand for bonds which, in turn, forces the interest rate payable on bonds to rise and this pushes mortgage rates higher.
But what’s been fascinating to watch is that over the past couple of weeks, rates have actually been dropping which is certainly counterintuitive given where inflation is today. And the only reason I can see for this is that bond traders were thinking that inflation might be topping out.
But then we got the June CPI numbers, and it certainly didn’t suggest that inflation was slowing, in fact it showed the opposite. But even though the total inflation rate hasn’t yet peaked, I believe that a shift has actually started and that we are closer to a peak in inflation than you may think.
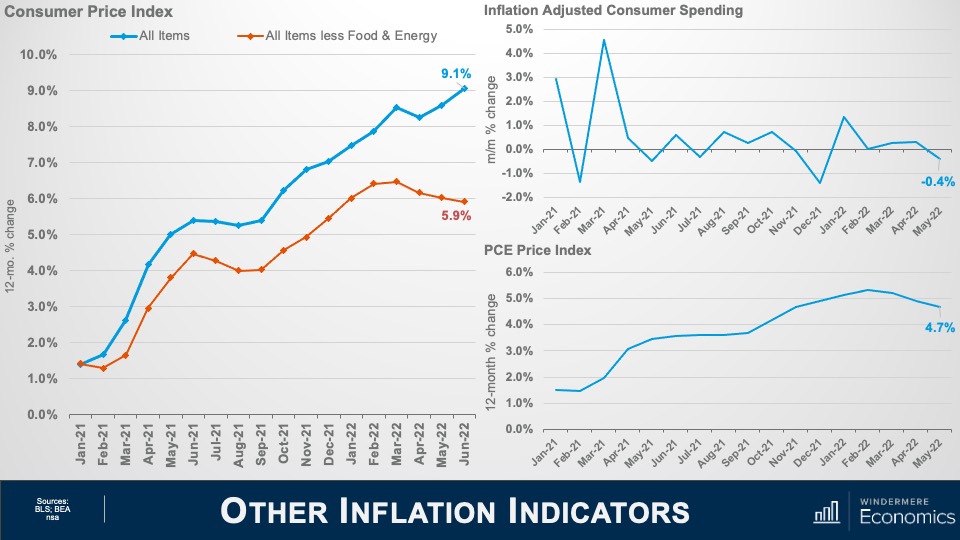
Indicators of Inflation: Consumer Spending
The June CPI report showed the headline inflation rate still trending higher but look at the core rate which excludes the volatile food & energy sectors. That has actually been pulling back for the past three months. And consumer spending when adjusted for inflation fell 0.4% in May. That’s the first monthly drop since last December, and I expect the June number when it comes out at the end of the month to show spending dropping even further.
This is a very important dataset that often gets overlooked but it is starting to tell me that the economy is slowing because of inflation and slower spending acts as a headwind to further price increases.
The core PCE price index is up 4.7% year-over-year, but this was the smallest annual increase since last November and you can see that it is also starting to roll over. This index is actually the Fed’s favored measure of inflation as it’s more comprehensive that the CPI number as it measures the change in spending for all consumers, not just urban households.
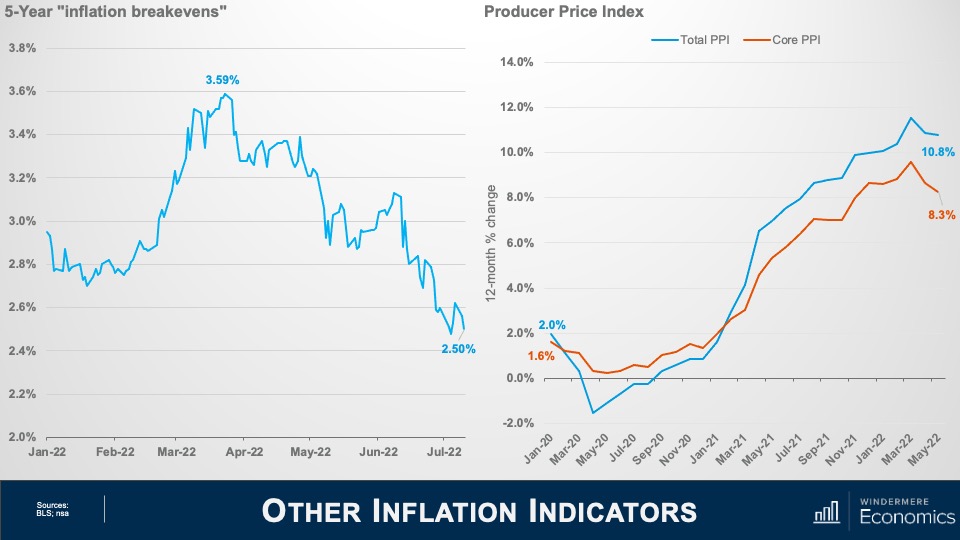
Indicators of Inflation: 5-Year Breakevens and Producer Price Index
The five-year “inflation breakeven” has plunged more than a full percentage point since peaking at just under 3.6% in late March. And this number is important as it lets us know where bond traders expect the average inflation rate to be over the next five years.
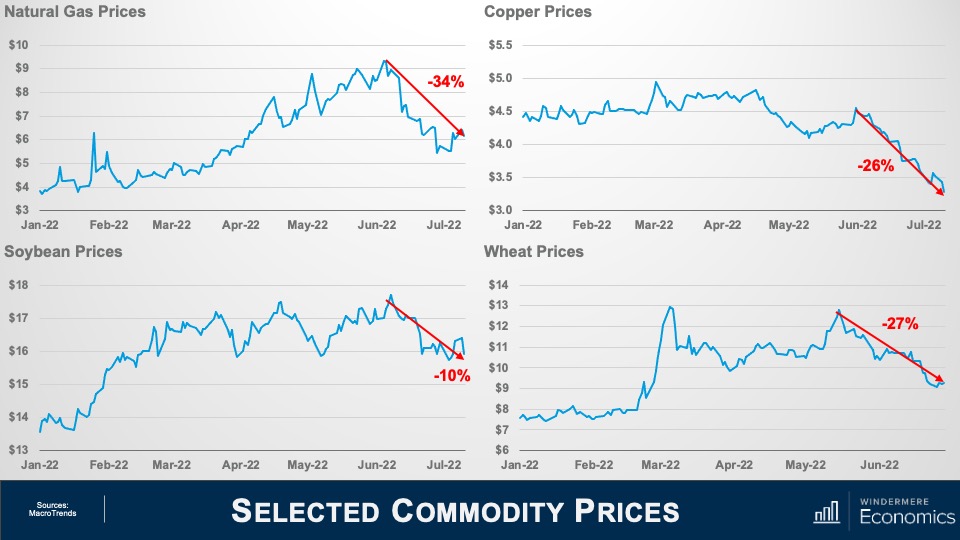
The Producer Price Index measures inflation at the wholesale, not retail, level and even though the total rate rose as energy costs continue to impact the manufacturing sector, the core rate has been pulling back for the past three months. Now let’s look at some commodity prices and see what’s going on there.
The price for natural gas is down over 34% from its recent high
Copper prices are down 26% from the recent June peak and down substantially from March
Soybean prices are down 10%
Despite the war in Ukraine, wheat prices are down 27% from June
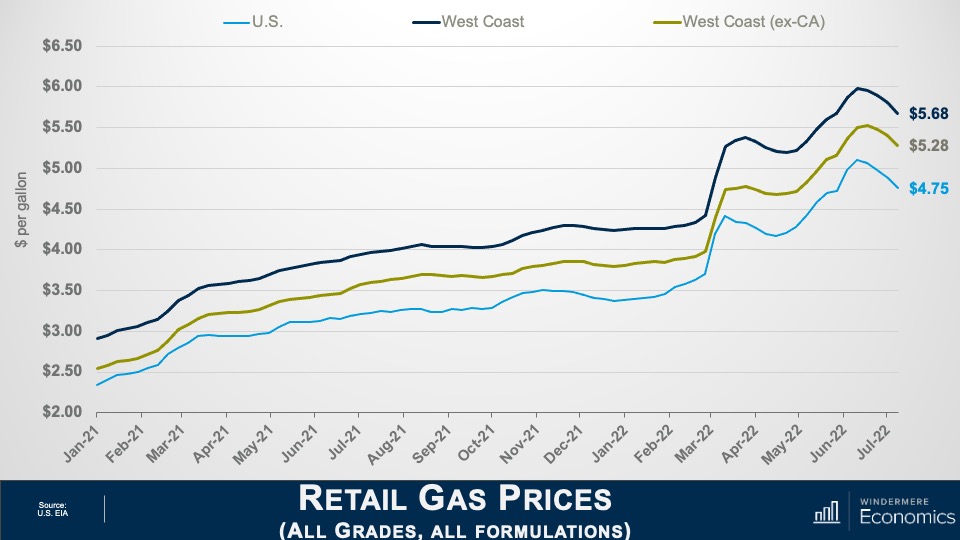
Retail Gas Prices: West Coast, West Coast Excluding CA, U.S.
It appears as if gas prices have also rolled over. Of course, here on the West Coast it’s more expensive than the nation even when you take California out of the equation.
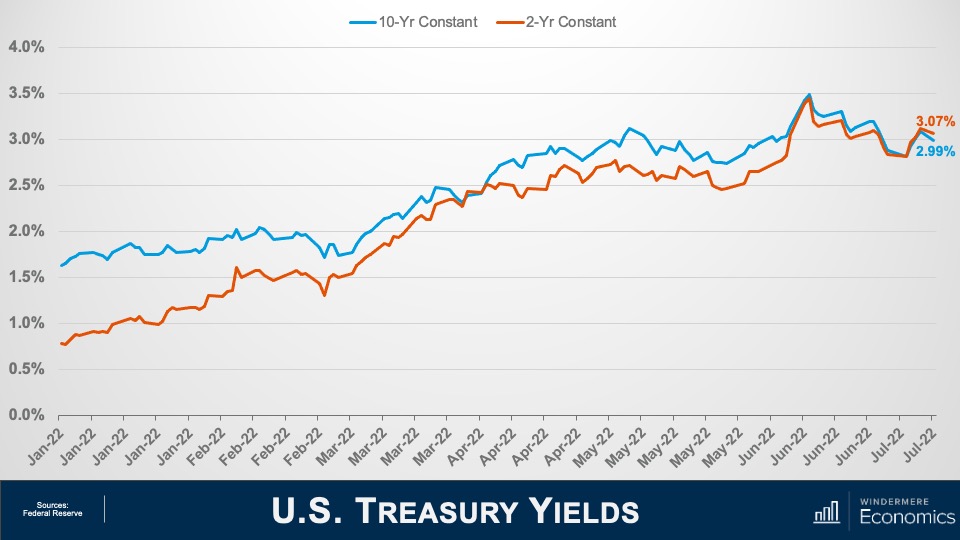
U.S. Treasury Yields: 10-Year and 2-Year Constant
And finally, to cap things off, traders must also be pondering the same numbers as I am because bond yields themselves have been tumbling at both the long and short ends of the yield curve with the 10-year note still yielding less than 3% even after the CPI report and two-year yields, while still elevated, are still down from 2.42% just two weeks ago.
So, given all the charts we have looked at, I hope that you too are seeing some light at the end of the tunnel when it comes to the likelihood that inflation is about to start easing.
No doubt, the headline inflation number for June wasn’t one that anyone wanted to see but, if the trends we have looked at continue, I still expect inflation to start slowly creeping lower, which will push bond prices higher, yields will start to pause—if not drop—and that will allow mortgage rates to hold at or close to their current levels for the time being. Although we could see rates coming down, though they will still start with a five for the foreseeable future. I hope that you have found my thoughts of interest.
About Matthew Gardner
As Chief Economist for Windermere Real Estate, Matthew Gardner is responsible for analyzing and interpreting economic data and its impact on the real estate market on both a local and national level. Matthew has over 30 years of professional experience both in the U.S. and U.K.
In addition to his day-to-day responsibilities, Matthew sits on the Washington State Governors Council of Economic Advisors; chairs the Board of Trustees at the Washington Center for Real Estate Research at the University of Washington; and is an Advisory Board Member at the Runstad Center for Real Estate Studies at the University of Washington where he also lectures in real estate economics.
This blog post contains excerpts of the “Remodeling 2022 Cost vs. Value Report” (costvsvalue.com).1
As you prepare to sell your home, one of the major considerations you may face is whether to remodel, and if so, how to allocate your remodeling budget. Remodeling can help differentiate your home from competing listings in your area, but this competitive advantage comes at a price.
The following information provides insight on which remodeling projects deliver high ROI. To maximize the value of your remodel, talk to your agent about what buyers in your area are looking for and align your efforts accordingly.
High ROI Remodeling Projects to Increase Home Value
It’s no secret that buyers want to see a home with curb appeal and attractive interior spaces. But as a seller, you’ll only have so much budget to work with and you want to get the most return on your investment. As laid out below, here are the five highest ROI remodeling projects nationwide as found in the Remodeling 2022 Cost vs. Value Report (www.costvsvalue.com).1
Remodeling Project
Cost of Remodeling Project (2022)
Resale Value of Remodeling Project (2022)
ROI
Garage Door Replacement
$4,041
$3,769
93.3%
Manufactured Stone Veneer
$11,066
$10,109
91.4%
Minor Kitchen Remodel (Midrange)
$28,279
$20,125
71.2%
Siding Replacement (Fiber – Cement)
$22,093
$15,090
68.3%
Window Replacement (Vinyl)
$20,482
$13,822
67.5%
This data shows that for a given remodeling project a higher expenditure doesn’t necessarily equate to higher ROI. It’s interesting to note that only one indoor project—the minor kitchen remodel—placed in the Cost vs. Value Report’s top five.
Four of the Cost vs. Value Report’s bottom six entries are upscale remodeling projects, all with roughly a 50% average return on investment. The conclusion to be drawn here is that remodels of this magnitude are expensive and should be considered carefully before you greenlight them. The upside to these projects, though, is that they have a much higher resale value than a simple fresh coat of paint or a change in décor. If you and your agent identify a logical upscale remodel with serious resale potential whose costs you can handle, it can help you get the best price for your home.
So, does this mean you should replace your garage door before selling your home bar none? Not necessarily. Again, your remodeling priority list should target the areas of your home that need attention while aligning with local buyer interest. Your agent can provide guidance on what competing listings in your area are offering and refer you to trusted remodeling contractors in your area.
Though smaller scale home makeovers don’t have the value-adding power of larger remodeling projects, they can still make a difference when selling your home.
Instead of an upscale kitchen remodel, you can focus more on making minor improvements in several areas. For example, repainting or refinishing your cabinets, swapping out your drawer pulls and hardware, and installing new appliances can make your kitchen feel brand new with a smaller budget. When remodeling your bathroom, tasks like refinishing your tub, installing new lighting, and a new backsplash can make a strong impression on buyers.
There’s a first time for everything. As a first-time home buyer, navigating the uncharted territory of the home buying process can be challenging to say the least. Although every home purchase is unique, there are certain knowns that can help you manage your expectations. Once you’re ready to buy, knowing a bit more about how to approach the market will have you well on your way to getting the keys to your first home.
Managing Expectations as a First-Time Home Buyer
Local Market Conditions
Your local housing market conditions will loom large in the buying process. In a competitive market (i.e. a seller’s market), prices are being driven up by demand, sellers have the leverage during negotiations, and it may take a long time to find the right home. In such a market, you can expect to compete against multiple buyers where everyone is trying to sweeten their offer to make it stand out. This usually takes the form of waived contingencies, escalation clauses, and all-cash offers. Buying in a competitive market is challenging for any buyer, let alone a first-time home buyer. Having greater buying power and getting pre-approved for a mortgage are two key paths to bolstering your financial standing and improving your chances of submitting a winning offer.
Though finding the right home is never a cakewalk, the conditions of a buyer’s market will be in your favor. In such market conditions, sellers are competing for the attention of a limited pool of buyers and are more flexible during negotiations. With less competition around you, you can afford to be more patient and selective when pursuing available listings.
Which homes can you afford?
It’s easy to fall in love with a home based on its listing photos, but one look at the price tag can break the spell. By knowing which homes are in your budget, you’ll be able to focus your time and effort on listings that are financially feasible. And remember, there are a myriad of costs to buying a home beyond the listing price to include in your budget.
To get an idea of what you can afford, use our free Home Monthly Payment Calculator by clicking the button below. With current rates based on national averages and customizable mortgage terms, you can experiment with different values to get an estimate of your monthly payment for any home price. By using the Home Monthly Payment Calculator, you can make a well-informed estimation of whether it’s the right time to buy.
Working with Your Agent
Fortunately, you don’t have to take on the home buying process on your own. A buyer’s agent will help to manage your expectations from start to finish by helping you look for homes, make an offer, negotiate with the seller and their agent on your behalf, and provide clarity on the closing process. Beyond their ability to get down to brass tacks and help you purchase a home, your agent will be there to answer your questions, validate your emotions, and connect you to their network of helpful resources.

 Facebook
 X
X
 Pinterest
 Copy Link