Design February 20, 2024

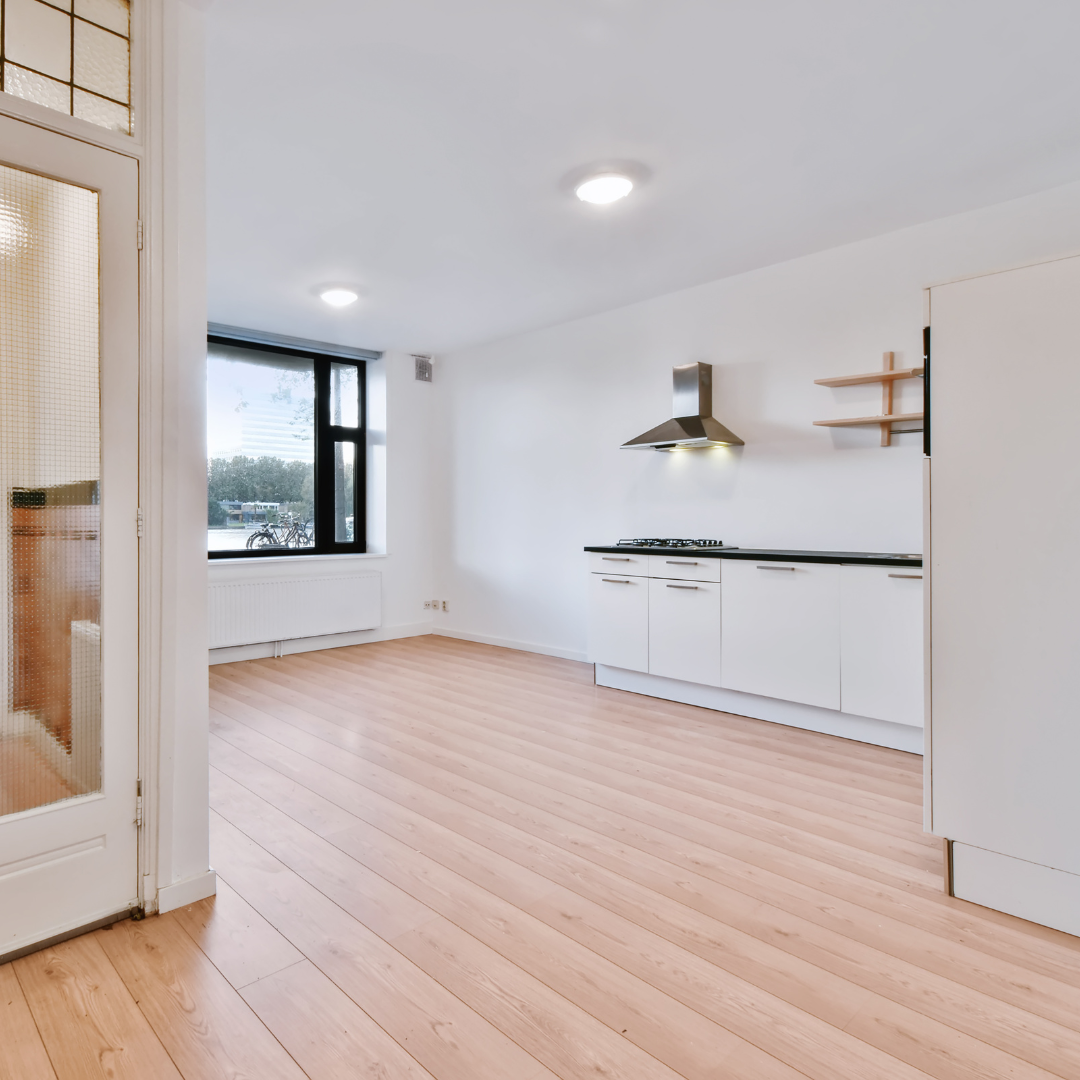
Benefits, Risks and Things to Consider Before You Add an Accessory Dwelling Unit to Your Home

SOURCE: Windermere

Have you ever rented a unit in someone’s basement? Maybe your significant other’s mom moved into the apartment above your garage? Or have you ever travelled and stayed in a pool house? Commonly referred to as “Mother-In-Law” units, homeowners use these as a way to fill the space in their home and gain residual income, either from vacationers or long-term tenants.

The official terms for these units are Additional Dwelling Units (ADU) or Detached Additional Dwelling Units (DADU), and are defined as extra spaces in homes and on properties where someone can live completely independent of the main house.

These units can be almost anywhere on the property, but they are usually located in the basement, in the backyard, or above the garage. They have their own bathroom, kitchen, and sleeping space and they will sometimes share laundry with the residents in the main house.

Thinking of adding a unit to your home? Here are some benefits and risks, as well as important aspects to consider before you build:


Benefits

Homeowners can maximize their investment by renting out the extra space to long-term tenants or short-term vacationers. These tenants can help pay off debt or create an extra stream of income.

Depending on several factors, including the size of the unit, the local real estate market, and other factors, each homeowner should decide which option they are more comfortable with. These decisions should be made before they list the unit for rent to find the right audience.


Risks

If you’re considering renting your space to someone for a long-term lease, there are some things you can do to minimize the risk of ending up with a tenant who turns into a financial burden. It’s strongly recommended that you use an application process to check backgrounds and employment history as a tool to get to know the potential tenant. Make sure to adhere to the National Fair Housing Laws and your local regulations.

If a short-term vacation rental makes more sense for you, many of the posting sites available have regulations and procedures to minimize the risks of having ill-intended strangers come through your property. You can determine which options are the best for you and be sure to take precautions like changing codes between visitors.


Things to Consider:

What are shared spaces?  

Identify the areas where it will be comfortable sharing those spaces, and potentially appliances, with other people. This is just as much about your privacy preferences as it is a consideration of what makes the most sense depending on your set up and what you’re willing to invest to make it more comfortable.

For example, you might be okay with sharing the washer and dryer with tenants, but if those are located in the main house and the unit is detached, it might not make sense. For long-term tenants that likely means adding laundry to the unit, however you don’t need to supply a washer or dryer for vacation renters who will only stay for short periods.


How close are the units and what noise level are you comfortable with? 

As a long-term landlord, tenants have the right to quiet enjoyment without the landlord impeding on their space or controlling their activities. If the unit is in the basement and the tenant has friends or family over, that noise could permeate into your unit in the late hours of the night. A way to prevent this is to be sure to layout quiet hours and expectations before they sign the lease or make an agreement so that you and the tenant are on the same page.

The same goes for the rules in the vacation rental listing. Managing expectations is the first way to create a relationship with the tenants, even for those who are only there for the weekend. Be clear in your rules and guidelines and have reminders in the unit.


What improvements are required?

Consider what elements and amenities the unit needs for the type of renter you want to attract. For example, long-term renters will need a kitchen, but vacationers will only likely need a kitchenette. Depending on the project, you might not get your money back in the short term, but if you’re dedicated to making the space worth it to rent it out over the next few years, improvements can be well worth the investment.


Whatever you decide, it’s important to be familiar with the rental market and regulations in both your local region and your neighborhood.


SOURCE: Windermere

Buying February 6, 2024

Buying with Your Pets in Mind

SOURCE: Windermere

For many of us, pets play a central role in our home life, so taking into account what is best for them when buying a home is important for both their happiness and that of your entire household.

Is the Neighborhood A Good Match For Your Pet?

When looking for homes that are well suited to both you and your furry companion, consider the area surrounding the home. If your pet is an indoor/outdoor animal, it’s important to examine the hustle and bustle of the neighborhood. If your pet spends time outside, a busy neighborhood could be dangerous, and depending on the level of traffic, he or she may need to be on a leash at all times.

How conducive is the neighborhood for taking your pet on walks? If you frequently walk your pet, look for neighborhoods with sidewalks. If your pet enjoys being off-leash, consider prioritizing homes with green belts, parks, trails, or designated off-leash areas nearby. It’s also a good idea to identify where the local emergency pet centers and veterinarian clinics are to insure there is sufficient medical care for your pet in proximity to where you live.


Does The House Meet the Needs of Your Pet?

  • Size: Is the house big enough? Depending on the type of pet, or breed of animal, space may be the most important factor in picking a pet-friendly home. If you are moving into a bigger space than you were in previously, understand your pet will likely take to the additional room differently. On the flip side, if you are downsizing, be mindful of how it might impact your pet.
  • Yard: If you have a pet that spends time outside, it’s important to pay particular attention to the yard. Is it large enough? Does it have a secure fence? Is there easy access between the home and the yard?
  • Flooring: Pet-friendly flooring can be tough. Surfaces that can be repaired or refinished when scratched are typically the best options for homes with pets. Sealing additional layers will build up the resistance to damage from paws, claws, and general pet wear and tear.
  • Carpet: Cats are notorious for clawing and scratching at carpet, and dogs are infamous for bringing the outdoors in with them. Consider carpeting of a lesser quality in the area where your pets spend most of the time, or search for carpets that are stain resistant and easy to clean.
  • Stairs: Older pets and multileveled homes are at odds. Consider the age of your pet and how active you expect them to be so that you don’t find yourself in a position where you’re having to carry your pet between floors.
  • Additions: If you’re comfortable with doing a little work on your potential home, you can consider adjustments that might make it a little more safe and comfortable for your pets. Adding an enclosed outdoor space for your cat called a catio or carving out space in the yard for a dog run can be just what your fur babies need.


What Does the HOA Say About Pets?

When looking at a home, ask whether or not it is a part of a Homeowners Association and what restrictions may apply to the property. For instance, certain HOA developments limit the number and/or type of pets per household.

Most pet owners take the needs of their pets seriously. In fact, in a recent Realtor.com survey, 95% of pet owners said that their pets needs were an important consideration when finding the right home to buy. When it comes down to it, prioritizing your pet when buying a home not only insures your pet’s well-being, but that of your household, as well.

SOURCE: Windermere

Windermere Community January 23, 2024

Windermere Foundation Brings Cheer, Laughter, and Basic Needs in the Final Months of 2023

SOURCE: Windermere

Windermere Real Estate offices throughout the Western U.S. brought holiday cheer and laughter to their local communities during the holiday season of 2023, wrapping up a year of giving that raised over $2.9 million for the Windermere Foundation, bringing the total raised since 1989 to more than $53 million.

Here are a few examples of the support provided by Windermere offices through the Windermere Foundation in the fourth quarter of 2023.


Bringing Holiday Cheer

Under Cover Elves in Central Washington

Windermere Group One continued a tradition and brought some holiday cheer to 21 deserving local families with their “Under Cover Elves” program. Since 2010, they have worked with the counselors at local schools to find and “adopt” families who were not able to buy gifts due to their financial situations. This year, some of the families were homeless, others were struggling after layoffs.

The school counselors mentioned too, that many support programs were not happening this year for families in need and they were grateful that the local Windermere offices were making this happen with Windermere Foundation funds.

More than 40 Windermere Real Estate agents and staff volunteers went shopping with the kids to buy presents for their parents and siblings. Many of the kids didn’t ask for things themselves, most lists consisted of everyday essentials like food, clothing, and cleaning supplies. But the volunteers were determined to add a few surprises too, so they did some digging while they shopped to find toys that they could add to the presents under the tree.

“The families were blown away from this event, so many thank you’s and tears of gratitude,” said Mikaya Blossner-Hill, the Marketing Director for the Windermere Group One offices.


A large group of people pose smiling in the Windermere Bozeman, MT office with a giant check made out to Greater Gallatin United Way for $5,000.

Image Sources: Windermere Bozeman, MT on Facebook

Giving Back in Bozeman, Montana

The team at the  Windermere Bozeman-Downtown office is fully devoted to supporting their neighbors in need and have a collective commitment to bettering the community they call home. One example of this is the $5,000 donation they made from the Windermere Foundation to the during the Greater Gallatin United Way weeks leading up to the holidays. The Greater Gallatin United Way raises funds from the community in order to invest in local non-profits working in four impact areas: basic needs (shelter, food security, transportation, and childcare), early learning, youth success, and behavioral health and mental well-being. The members of the Windermere Bozeman-Downtown office say that they feel incredibly fortunate to have the Greater Gallatin United Way looking out for their neighbors and their community.


2 photos lined up horizontally showing different angles of the "Dogs of Windermere Calendar" for 2023-2024. On the far left is the calendar open to May with a black french bulldog. The center shows the calendar open to may and a calendar closed with the front cover showing. On the right is a photo of the front page with a chocolate lab, the center

Image Source: Melissa Freels, Director of Marketing Windermere Services, Oregon

Raising Funds with a Crowd Favorite in Portland, Oregon

The Windermere Johnson office in Portland, Oregon held a fundraiser that made many people smile and raised money for the Windermere Foundation. At the end of 2023 they put together a “Dogs of Windermere” calendar for the year 2024. This adorable fundraiser earned over $1,100 for the Windermere Foundation by selling copies of the calendars and with submissions from agents who sent in the cutest photos of their dogs they could muster; it wasn’t that hard. With such a successful first run they plan to do it again next year.


Windermere For Kids in Bellevue, Washington

Continuing their yearly tradition, Windermere East, Inc. helped deliver holiday spirit to low-income and homeless families from in and around Bellevue, Washington with their “Windermere for Kids” event. In December, they invited over 100 local children to the Marketplace at Factoria to do their holiday shopping with 250 agents from six Windermere offices.

Each child and their families received $250 to buy gifts at Target, which were then wrapped by the Windermere Real Estate agents while the families enjoyed snacks and took photos with an elf. And as an added treat, the agents who helped them shop added a surprise gift for each “Little Shopper.”


A group of Windermere agents pose smiling by paper bags full of food from their annual Can the Cats Food Drive benefiting Missoula Food Bank and Community Center.

Image Sources: Windermere Missoula, MT on Facebook


Can the Cats in Missoula, Montana

The agents in the Windemere Missoula office continued their tradition of collecting and donating food to the for their annual “Can the Cats Food Drive”. Now in its twenty-fourth year, the Can the Cats Food Drive is held every November leading up to the University of Montana vs. Montana State University “Griz-Cat Brawl of the Wild” rivalry football game. Missoulians are encouraged to donate food and cash which benefits thousands of households experiencing food insecurity in Missoula County. The Windermere Missoula team collected over 2,000 pounds of food from their local community which was delivered in bags donated by WinCo Foods Missoula. This was the eighth year Windermere Missoula participated in this event which Managing Broker John Brauer says is great fun and an incredible team-building experience.


Bringing Laughter and Raising Funds in Portland, Oregon and Seattle, Washington

Comedy Night

The Windermere Foundation expanded the annual comedy night held in Portland, OR for the last 22 years to bring even more laughter and raise more money with another event in Seattle, WA.

Both events in 2023 featured Saturday Night Live comedian, Colin Jost. Together they raised over $1.1 million for local organizations supporting youth and families in need.

The annual Steve Allen Comedy Show in Portland, OR was founded by Windermere and benefits non-profit organization New Avenues for Youth, which is dedicated to the prevention and intervention of homelessness for Portland-area young people. The event helps New Avenues for Youth provide programs and services to young people in Portland that focus on the individual – their experiences, identities, needs and goals—and helping them make positive changes in their lives.  From meals and counseling to job training and housing, their equity-based services address the many barriers to stability and well-being that young people face.

The inaugural Windermere Foundation Comedy Night in Seattle was organized by and benefited the Windermere Foundation, which has been giving back to the local communities where Windermere Real Estate agents live and work for 35 years. More than 400 people came together for a laughter-filled evening that included dinner, drinks, and an amazing amount of generosity. The money raised from ticket sales and the paddle raise will support organizations in the Seattle area that provide services to low-income and homeless children and families.

SOURCE: Windermere

Selling January 11, 2024

What Is Fair Market Value (FMV) in Real Estate?

What Is Fair Market Value (FMV) in Real Estate?

SOURCE: Windermere

You know your home is a valuable asset, but what is it actually worth? One of the most important figures to understand as you get ready to sell your home is Fair Market Value (FMV); it is key to a successful home sale. We’ll break down what Fair Market Value is and why it plays such a crucial role in the home selling process.

What Is Fair Market Value?

Fair Market Value (FMV) is the estimated price a property would sell for between a willing buyer and a willing seller, given that each party knows all the relevant information associated with the property. In other words, it’s the price your home is likely to sell for under the current conditions of your local real estate market.

The Important of Fair Market Value

Yes, you can research home prices on your own and get an idea of what your home is worth. However, accurately pricing your home requires a more in-depth approach. Your agent’s Comparative Market Analysis (CMA) will take into account the various factors that influence home prices using comprehensive data available to real estate agents on the Multiple Listing Service (MLS).

So, what’s the point of this detailed analysis? Pricing your home accurately is paramount. If it’s overpriced, you may deter potential buyers and it will lose value over time as it continues to sit on the market. If it’s priced too low, you might leave money on the table. FMV helps you strike the right balance.

You can also use Automated Valuation Models (AVMs) to see what your home could be worth. (That was the last acronym in this post, we promise!) These calculators give you a general idea of your home’s value, but AVMs are not 100% accurate. They’re a great starting point, but again, your agent’s resources will ultimately determine the right price for your home.

Fair Market Value sets the stage for smooth negotiations later in the home selling process. With a solid price in place, you’ll get reasonable offers from buyers. You and your agent will discuss whether to accept or counter the buyer’s offer and how to handle their contingencies. Finally, FMV makes the home appraisal process easier. With an accurate valuation in place, you can proceed knowing that the chances of a mismatching appraisal are low.

How Is FMV Calculated?

Several factors influence the Fair Market Value of a property. Comparable sales or “comps” play a significant role in determining FMV. Real estate professionals analyze recently sold homes in your area that are similar to yours, providing a benchmark for pricing your property. The property’s condition, its size, and location all factor into the math as well. Appraisers may also use a cost-based approach to determine FMV if they can’t find sufficient comparable homes in your area.

You can get a ballpark estimate of your home’s value by looking at tools online but determining a precise value will require the expertise of your real estate agent. To see what your home is worth, or for answers to all your home selling questions, connect with me today.

SOURCE: Windermere

Design December 20, 2023

What is Italianate Architecture?

Italianate architecture has roots in Italy’s countryside villas, palaces, and overall romantic building aesthetic. Those ancient buildings inspired a new wave of home design that borrowed from the classic concepts found throughout a country beloved for its classic details and charm. Let’s dive into this special version of Mediterranean design to learn what makes it so appealing.

History of Italianate Architecture

Emerging in the early 1800s as part of a classic architecture movement of the time, the Italianate architectural style was inspired by Italy’s awesome and inspiring classic buildings. The goal in creating this style of home design was to share the grand and charming characteristics of Italian architecture with the world. Closely associated with the Victorian period, Italianate architecture gained popularity in Europe and the U.S. during the 19th century.

An example of Italianate architecture: a stucco two-story house with dressed windows, a central awning on the top floor, and a gated entry. The house’s exterior is a classic Tuscan yellow.

Italianate architecture detached house | Image Source: Getty Images | Image Source: tomch

What is Italianate architecture?

For those who dream of taking a vacation to an Italian villa or countryside estate, this architectural style is for you. Square and symmetrical, homes built in this style are typically constructed from brick, stone, or stucco with well-constructed masonry walls. Common features of these distinct homes include tile flooring, columned entryways, and rounded windows.

Italianate houses typically have low-pitched roofs or a belvedere to capture views and emphasize verticality. The windows are a focal point of Italianate home exteriors. Tall and narrow, they are decorated with elaborate crown molding or hoods, evoking the grandeur of palatial Italian buildings. The Italianate style comes in many shapes and sizes, from townhouses and row houses to countryside estates and mansions.

An example of Italianate architecture: an extended row house structure in downtown Trieste, Italy. Each room has a curved window decorated with ornate trim facing the street and a small ledge. There are columns on the ground floor and halfway up the central building.

Italianate architecture row house in Trieste, Italy | Image Source: Getty Images | Image Source: Leonid Andronov

Market NewsMatthew Gardner December 5, 2023

Matthew Gardner’s Top 10 Housing Predictions for 2024


This video shows Windermere Chief Economist Matthew Gardner’s Top 10 Predictions for 2024. Each month, he analyzes the most up-to-date U.S. housing data to keep you well-informed about what’s going on in the real estate market. See more market insights on our blog here. 


Matthew Gardner’s Top 10 Predictions for 2024

1. Still no housing bubble

This was number one on my list last year and, so far, my forecast was spot on. The reason why I’m calling it out again is because the market performed better in 2023 than I expected. Continued price growth, combined with significantly higher mortgage rates, might suggest to some that the market will implode in 2024, but I find this implausible.

2. Mortgage rates will drop, but not quickly

The U.S. economy has been remarkably resilient, which has led the Federal Reserve to indicate that they will keep mortgage rates higher for longer to tame inflation. But data shows inflation and the broader economy are starting to slow, which should allow mortgage rates to ease in 2024. That said, I think rates will only fall to around 6% by the end of the year.

3. Listing activity will rise modestly

Although I expect a modest increase in listing activity in 2024, many homeowners will be hesitant to sell and lose their current mortgage rate. The latest data shows 80% of mortgaged homeowners in the U.S. have rates at or below 5%. Although they may not be inclined to sell right now, when rates fall to within 1.5% of their current rate, some will be motivated to move.

4.Home prices will rise, but not much

While many forecasters said home prices would fall in 2023, that was not the case, as the lack of inventory propped up home values. Given that it’s unlikely that there will be a significant increase in the number of homes for sale, I don’t expect prices to drop in 2024. However, growth will be a very modest 1%, which is the lowest pace seen for many years, but growth all the same.

5. Home values in markets that crashed will recover

During the pandemic there were a number of more affordable markets across the country that experienced significant price increases, followed by price declines post-pandemic. I expected home prices in those areas to take longer to recover than the rest of the nation, but I’m surprised by how quickly they have started to grow, with most markets having either matched their historic highs or getting close to it – even in the face of very high borrowing costs. In 2024, I expect prices to match or exceed their 2022 highs in the vast majority of metro areas across the country.

6. New construction will gain market share

Although new construction remains tepid, builders are benefiting from the lack of supply in the resale market and are taking a greater share of listings. While this might sound like a positive for builders, it’s coming at a cost through lower list prices and increased incentives such as mortgage rate buy downs. Although material costs have softened, it will remain very hard for builders to deliver enough housing to meet the demand.

7. Housing affordability will get worse

With home prices continuing to rise and the pace of borrowing costs far exceeding income growth, affordability will likely erode further in 2024. For affordability to improve, it would require either a significant drop in home values, a significant drop in mortgage rates, a significant increase in household incomes, or some combination of the three. But I’m afraid this is very unlikely. First-time home buyers will be the hardest hit by this continued lack of affordable housing.

8. Government needs to continue taking housing seriously

The government has started to take housing and affordability more seriously, with several states already having adopted new land use policies aimed at releasing developable land. In 2024, I hope cities and counties will continue to ease their restrictive land use policies. I also hope they’ll continue to streamline the permitting process and reduce the fees that are charged to builders, as these costs are passed directly onto the home buyer, which further impacts affordability.

9. Foreclosure activity won’t impact the market

Many expected that the end of forbearance would bring a veritable tsunami of homes to market, but that didn’t happen. At its peak, almost 1-in-10 homes in America were in the program, but that has fallen to below 1%. That said, foreclosure starts have picked up, but still remain well below pre-pandemic levels. Look for delinquency levels to continue rising in 2024, but they will only be returning to the long-term average and are not a cause for concern.

10. Sales will rise but remain the lowest in 15 years

2023 will likely be remembered as the year when home sales were the lowest since the housing bubble burst in 2008. I expect the number of homes for sale to improve modestly in 2024 which, combined with mortgage rates trending lower, should result in about 4.4 million home sales. Ultimately though, demand exceeding supply will mean that sellers will still have the upper hand.


About Matthew Gardner

As Chief Economist for Windermere Real Estate, Matthew Gardner is responsible for analyzing and interpreting economic data and its impact on the real estate market on both a local and national level. Matthew has over 30 years of professional experience both in the U.S. and U.K.

In addition to his day-to-day responsibilities, Matthew sits on the Washington State Governors Council of Economic Advisors; chairs the Board of Trustees at the Washington Center for Real Estate Research at the University of Washington; and is an Advisory Board Member at the Runstad Center for Real Estate Studies at the University of Washington where he also lectures in real estate economics.

Living November 30, 2023

How to Stay Safe at Home During a Power Outage

SOURCE: Windermere

How to Stay Safe at Home During a Power Outage

A stormy night with the lights out can complicate things at home. But with the right preparation, you and your household can switch gears quickly and ride out the blackout period, however long it may last. Power outages can happen unexpectedly, so taking the necessary steps to have a plan in place should be a priority. We’ll walk through some essential steps to stay safe, calm, and cozy when the lights go out.

Lighting During a Power Outage

The first thing you’ll miss during a power outage is light. Make sure you have flashlights, candles, lanterns, and plenty of batteries readily available. Check your devices to see which size batteries they require and make sure you have all the necessary sizes on hand. LED lanterns are energy-efficient and will stay lit for a long time to provide some illumination during an extended blackout.

Emergency Kit

A well-stocked emergency kit is essential during a power outage. Make sure you have a substantial supply of non-perishable food, bottled water, and an assortment of basic utensils. Along with your emergency kit, keep a first aid kit handy to ensure you’re fully prepared for a blackout-related emergency.

Staying Warm During a Power Outage

Even though the lights in your home are out, that doesn’t mean you have to be uncomfortable as you wait for them to come back on. This is especially important if the power outage occurs during the colder months of the year. Keep plenty of blankets and extra layers of clothing close by to make sure you and your family stay cozy. If you have a portable heater that you plan to use, pay attention to the manufacturer instructions to avoid possible carbon monoxide poisoning.

Home Security

Home safety and security is vital during a power outage. Make sure your home’s security system’s motion-activation is still functioning properly, and if it has a backup system, check that too. Unfortunately, some burglars may see a blackout as an opportunity to take advantage of the low-visibility conditions. Lock your windows and secure the deadbolts on your door so you and your household can wait out the power outage in peace.

Preserve Food

Try to keep your refrigerator and freezer closed as much as possible. Use your perishable food rations in your emergency kit as a first option for a meal during the power outage and stick to other non-perishable food items in your pantry. Hopefully, the power will come back on soon enough and you’ll be able to resume your normal food preparation. But if you’re constantly opening the fridge and freezer while the power’s out, your food will spoil quickly, and you could have quite a mess on your hands.

Staying Entertained

Who says you can’t have fun during a power outage? With all your preparations in place, a blackout presents the chance for you and your household to enjoy some electronic-free activities. Have board games, books, arts and crafts materials, and decks of cards at the ready. If you have kids, plan some fun activities ahead of time that they’ll enjoy.

SOURCE: Windermere

Buying November 14, 2023

What Does DOM Mean in Real Estate?

SOURCE: Windermere

What Does DOM Mean in Real Estate?

As you start searching for homes, you’ll likely come across different terms that describe the status of different listings. One term, “Days on Market” (DOM), can play a role in your strategy for making an offer. Knowing what this term means will help to inform your discussions with your agent as you go about finding the right home for you.

What is Days on Market (DOM)?

Days on Market (DOM) is a metric used by real estate professionals (and home buyers) to measure the time that a certain property has been listed for sale. In other words, it’s the running total number of days since a home hit the market. Different factors contribute to how long a home is on the market, including the home’s features, its location, and the local market conditions. Brush up on seller’s and buyer’s markets to understand how these market conditions affect days on market.

Why does DOM matter?

  • Buyer Hesitancy: Just like contingent and pending listings, a home with a longer Days on Market may make buyers think there is something wrong with the property. The right buyer may very well come along, not swayed in their decision by the DOM number, but for some, it raises questions about why the home hasn’t sold yet.
  • Market Value: Over time, Days on Market can impact the home’s listing price and how much it ultimately sells for. If a property stays on the market for an extended period, the seller may need to reduce the price to prevent it from going stale. On the other hand, the longer the DOM, the more leverage a buyer potentially has to negotiate a more favorable offer.
  • Local Market Conditions: Looking at trends in DOM can give both buyers and sellers a better understanding of local market conditions. If homes are flying off the market left and right with low DOM, it’s a competitive market that favors sellers. Buyers will be more likely to remove contingencies to make their offer stand out amongst the competition. If DOM is high across the board, the market is not as competitive, and buyers have more leverage.
  • Negotiations: The leverage created by Days on Market flows through to negotiations. If you have leverage on your side, you can expect that the seller will be more willing to negotiate on price or repairs than they would if the tables were turned. Make sure you and your agent are on the same page regarding how the DOM figures you’re seeing locally will affect your strategy for making an offer on a house.

Connect with me for more information about Days on Market (DOM) and how long homes are staying on the market near you. This one statistic could alter your strategy for approaching the market and, when the time comes, how you put together your offer on a home.

SOURCE: Windermere

Market NewsMatthew Gardner November 3, 2023

Q3 2023 Utah Real Estate Market Update

The following analysis of select counties of the Utah real estate market is provided by Windermere Real Estate Chief Economist Matthew Gardner. We hope that this information may assist you with making better-informed real estate decisions. For further information about the housing market in your area, please don’t hesitate to contact your Windermere Real Estate agent.


Regional Economic Overview

After picking up in the second quarter of this year, year-over-year employment growth has pulled back again. Utah added 39,000 jobs over the past 12 months, which represents an annual growth rate of 2.3%. This is the lowest pace of job gains since the pandemic started. Job growth was led by the Salt Lake City metro area, where employment rose 2.7%. This was followed by the Ogden and Provo metro areas, where employment rose 2.4% and 1.7%, respectively.

Utah’s unemployment rate in August was 2.5%, which is up .1% year over year. At the county level, the lowest jobless rate was in Morgan County (2.5%) and the highest was in Weber County, where 3.1% of the workforce were without jobs. In aggregate, the unemployment rate within the counties contained in this report was 3%.

Utah Home Sales

❱ In the third quarter of 2023, 6,675 homes sold in the areas covered by this report. This was down 9.5% compared to the third quarter of 2022 and was 5.7% lower than in the second quarter of this year.

❱ Although total sales volumes have fallen, they rose in Wasatch, Summit, and Morgan counties compared the third quarter of 2022. These same three counties also saw sales grow between the second and third quarters of this year.

❱ As sales volumes fell, listing activity rose 28.7% compared to the second quarter of 2023. Clearly, more choice in the market was not enough to tempt buyers who were also faced with significantly higher financing costs.

❱ Pending sales fell 8.9% from the second quarter, suggesting that closings in the fourth quarter may also be lackluster.

A bar graph showing the annual change in home sales by county in Utah from Q3 2022 to Q3 2023. Weber County had the least change with -4.2% and is represented with the bar in the center of the graph. Morgan County had the greatest increase of 40% and Davis County had the greatest decrease of 13.5 percent.

Utah Home Prices

❱ The average sale price grew 4% from the same time in 2022 to $651,913. Prices were also 3.8% higher than in the second quarter of 2023.

❱ Regionally, median list prices in the third quarter were flat compared to the second quarter of the year. However, asking prices were higher in Wasatch, Summit, and Morgan counties.

❱ Year over year, prices rose in four counties but fell in three. With just 28 sales in the quarter, Morgan County had a significant price increase, but it’s such a small market that sizeable price swings are not unusual. Compared to the second quarter of 2023, prices rose in all counties except Davis and Summit, where prices fell 1.7% and 13.8%, respectively.

❱ Price growth has been slowing, which is to be expected given the significant rise in mortgage rates. I don’t expect to see much in the way of price growth for the balance of the year due to both higher financing costs and more choice in the market.

A map showing the real estate home prices percentage changes for various counties in Utah. Different colors correspond to different tiers of percentage change. Morgan and Summit Counties came in above 6% and are represented in the corresponding navy color. Weber and Salt Lake came in the 2 and 3.9% range. Davis, Wasatch, and Utah Counties were in the -0.1% to -2% range and are represented in the light grey color on the map.

A bar graph showing the annual change in home sale prices by county in Utah from Q3 2022 to Q3 2023. Utah County had the least change at -0.1% while Davis had the greatest decrease of 1.8% and Morgan had the greatest increase of 30.4%.

Mortgage Rates

Mortgage rates continued trending higher in the third quarter of 2023 and are now at levels we have not seen since the fall of 2000. Mortgage rates are tied to the interest rate (yield) on 10-year treasuries, and they move in the opposite direction of the economy. Unfortunately for mortgage rates, the economy remains relatively buoyant, and though inflation is down significantly from its high, it is still elevated. These major factors and many minor ones are pushing Treasury yields higher, which is pushing mortgage rates up. Given the current position of the Federal Reserve, which intends to keep rates “higher for longer,” it is unlikely that home buyers will get much reprieve when it comes to borrowing costs any time soon.

With such a persistently positive economy, I have had to revise my forecast yet again. I now believe rates will hold at current levels before starting to trend down in the spring of next year.

A bar graph showing the mortgage rates from Q3 2021 to the present, as well as Matthew Gardner's forecasted mortgage rates through Q3 2024. In Q3 2023 Mortgage Rates hit 7.04% and Matthew Gardner predicts rates will decrease steadily over the next 4 quarters.

Utah Days on Market

❱ The average time it took to sell a home in the counties covered by this report rose 17 days compared to the same period in 2022.

❱ Homes sold fastest in Salt Lake County; Wasatch County was the slowest. All areas saw market time rise compared to the third quarter of 2022, but all counties except Wasatch saw market time fall compared to the second quarter of this year.

❱ During the third quarter, it took an average of 52 days to sell a home. Market time fell three days compared to the second quarter of 2023.

❱ Even when faced with more inventory and higher financing costs, it was impressive to see the length of time it took to sell a home in the region fall, albeit modestly, from the second quarter.

A bar graph showing the days on market by county for homes in Utah in Q3 2023. Salt Lake County is at the top with the least days on market of 35 and Wasatch is at the bottom of the graph with the most days on market of 74. Weber and Utah Counties are in the middle with 44 days on market.

Conclusions

This speedometer reflects the state of the region’s real estate market using housing inventory, price gains, home sales, interest rates, and larger economic factors.

The region saw average market time fall even though the number of available homes rose, which should favor home sellers. That said, closed and pending sales fell, and list price growth was flat.

This suggests to me that the market is lacking direction, which is to be expected given that mortgage rates are at their highest level in over 20 years. Current buyers are likely weighing whether interest rates will come down and, if they do, how long they’ll have to wait to refinance out of a loan with a rate well above seven percent.


A speedometer graph indicating the market in Utah for Q3 2023. The needle points to the middle of the meter in the “balanced market” portion.

Inventory growth and mortgage rates aside, the market has seen a very significant runup in prices since the start of the pandemic, so it wouldn’t surprise me if both prices and sales remain fairly static for the balance of the year.

As such, I am moving the needle more toward the middle, with neither buyers nor sellers really having the upper hand.

About Matthew Gardner

Matthew Gardner - Chief Economist for Windermere Real Estate

As Chief Economist for Windermere Real Estate, Matthew Gardner is responsible for analyzing and interpreting economic data and its impact on the real estate market on both a local and national level. Matthew has over 30 years of professional experience both in the U.S. and U.K.

In addition to his day-to-day responsibilities, Matthew sits on the Washington State Governors Council of Economic Advisors; chairs the Board of Trustees at the Washington Center for Real Estate Research at the University of Washington; and is an Advisory Board Member at the Runstad Center for Real Estate Studies at the University of Washington where he also lectures in real estate economics.

Market UpdatesMatthew Gardner October 24, 2023

U.S. Housing Market 2023: Updated Analysis

Windermere Chief Economist Matthew Gardner gives an updated analysis of the U.S. housing market in 2023, using data released by The National Association of REALTORS® on listing activity, home sales, price growth, and more.

This video is the latest in our Monday with Matthew series with Windermere Chief Economist Matthew Gardner. Each month, he analyzes the most up-to-date U.S. housing data to keep you well-informed about what’s going on in the real estate market.


U.S. Housing Market 2023

Hello there, I’m Windermere Real Estate’s Chief Economist Matthew Gardner and welcome to this month’s episode of Monday with MatthewThe National Association of REALTORS® released their data on the U.S. housing market in August, and it contained a few things which I found interesting and wanted to share with you.

Listing Activity

A triple line graph showing the inventory of homes for sale in the U.S. from 2000 to 2023, U.S. single-family homes for sale from 2013 to 2023, and U.S. condo/co-op homes for sale from 2013 to 2023. All three graphs show a downward trend from the mid-2010s to 2023.


As you can clearly see here, the number of homes for sale remains at close to historic lows. When adjusted for seasonality, there were just 1.03 million single-family and condominium homes for sale in the month of August, and that’s down 8.3% from a year ago and the second lowest level in 2023. When adjusted for seasonal variations, there were just over 911,000 single-family homes for sale in the month, that’s 15% lower than a year ago and 36% below August of 2019. And the condominium market is not faring any better with just over 123,000 units available for purchase, listing activity was down year-over-year by just over 9%.

Homes for Sale August 2023

A bar graph showing homes for sale in August from 2000 to 2023. Supply topped out in 2006 and 2007 at around nearly 4 million, before declining steadily to 2023, where supply is just over 1 million.


And to give you a little different perspective, this chart shows you the total number of units for sale in the month of August going back more than 20 years and I think it gives a pretty good indication as to how tight the U.S. housing market really is.

Now, we’ve talked before about the reasons why supply is so limited, and the blame is almost totally attributable to mortgage rates with sellers remarkably reluctant to move because that would mean losing the historically low mortgage rate that they currently benefit from. And as the old saying goes, “you can’t buy what’s not for sale,” and this is certainly true in the housing market today.

U.S. Housing Market 2023: Sales Activity

A triple line graph showing existing U.S. home sales from 2000 to 2023, U.S. single-family home sales from 2013 to 2023, and U.S. condo/co-op home sales from 2013 to 2023. All three graphs show a spike between 2020 and 2022 before declining sharply in 2023.


With such limited choice in the marketplace, it’s unsurprising to see home sales having plummeted following the pandemic induced surge we saw in 2021. At an annual sales rate of 4.04 million units, that is only 40,000 more than the low seen this January and we are now holding at levels we haven’t seen since 2010. Interestingly, single-family sales did see a little jump at the start of this year, but they have since pulled back—likely a function of rising financing costs, which were getting close to 7% in June.

But the condominium market, while certainly down significantly, appears to be somewhat more resilient. I find this interesting as we have not seen any palpable increase in listing activity for multifamily units.

Home Sale Prices Off All-Time High

A triple line graph showing the median sale price of U.S. Existing Homes from 2000 to 2023, the median sale price of single-family homes from 2013 to 2023, Median sale price of multifamily homes 2013 to 2023. All three show a gradual increase from 2013 to 2022, a peak in 2022, with the 2023 numbers being just below that peak.


When prices started to fall in the summer of 2022, many expected to see them continue to plunge in a manner similar to that seen following 2007 collapse, but that has certainly not been the case. Sale prices have rebounded and remain remarkably resilient—especially given significantly higher financing costs.

  • Although we did see a small drop in home prices between June and July of this year, U.S. home prices are only 1.6% below their 2022 peak; they’re up 3.9% year over year; and up by 11.1% from the start of 2023.

Single-family home prices paint a similar picture with prices down by 1.8% from peak; but up 3.7% year over year, and up 11.2% from the start of the year. Interestingly, sale prices in the Northeast were actually 3.5% higher in August than their 2022 peak. And condominium prices are just 0.1% below the high seen in June of last year. Prices are now up 6.2% year over year and are 11.6% higher than we saw at the end of 2022.

Now, of course the data shown here is unlikely to reflect the recent surge in mortgage rates so it will be interesting to see what impact that has not just on sales but sale prices when the September and October data is published.

My intuition suggests that—even with mortgage rates where they are today—as long as they don’t move significantly higher, prices at the national level are unlikely to collapse. But I do see sales volumes pulling back further as listing activity remains very constrained.

Price Growth vs Payment Growth

A double line graph showing price growth vs mortgage payment from Jan 2016 to July 2023. In 2023, mortgage payment growth sits at 26.5% while price growth is at 3.9%.


This chart shows a different way to look at the impact that mortgage rates are having on the market. The dark blue line shows year-over-year home price growth, and the light blue line shows the 12-month change in average mortgage payments.

Although we did see that annual growth in mortgage payments fall to just 10% in June of this year—the first time we have seen that since 2021—it has subsequently jumped back up. This means that a buyer of a median priced house in the U.S. is faced with payments that are 26 and a half percent higher than they were 12 months ago. At the same time, home price growth has stalled.

As I’ve mentioned in several past videos, I find it unlikely that inventory levels will increase significantly in 2023, and I also believe that supply will be constrained next year as well as rates remain at elevated levels.

As we know, it is this lack of inventory that has helped to support home prices; however, there is a breaking point. 10-year bond yields are holding at multi-year highs and do not appear to be thinking of pulling back at any time soon—especially given new bond issuances that the country is going bring to market in order to address our burgeoning debt levels.

And it’s because of this that I now expect to see rates remaining higher for longer, and the question then becomes how much tolerance will buyers have if mortgage rates hold where they are today or if they head closer to 8%.

Although I am not expecting this to happen, it is possible. And if it does, then sales will fall further and the underpinning of price stability will certainly be eroded. And there you have it. As always, I’d love to hear your thoughts on this subject so feel free to leave your comments below. Until next month, stay safe out there and I’ll see you soon. Bye now.

To see the latest housing data for your area, visit our quarterly Market Updates page.


About Matthew Gardner

As Chief Economist for Windermere Real Estate, Matthew Gardner is responsible for analyzing and interpreting economic data and its impact on the real estate market on both a local and national level. Matthew has over 30 years of professional experience both in the U.S. and U.K.

In addition to his day-to-day responsibilities, Matthew sits on the Washington State Governors Council of Economic Advisors; chairs the Board of Trustees at the Washington Center for Real Estate Research at the University of Washington; and is an Advisory Board Member at the Runstad Center for Real Estate Studies at the University of Washington where he also lectures in real estate economics.